How to check KPIs values on a daily basis?
KPIs values can be checked in a daily view, within the following screens:
- Dashboard > Statistics tab
- Dashboard > Daily View tab
- Day Inspector
- Timeline > Daily granularity (loaded by default)
Dashboard > Statistics tab
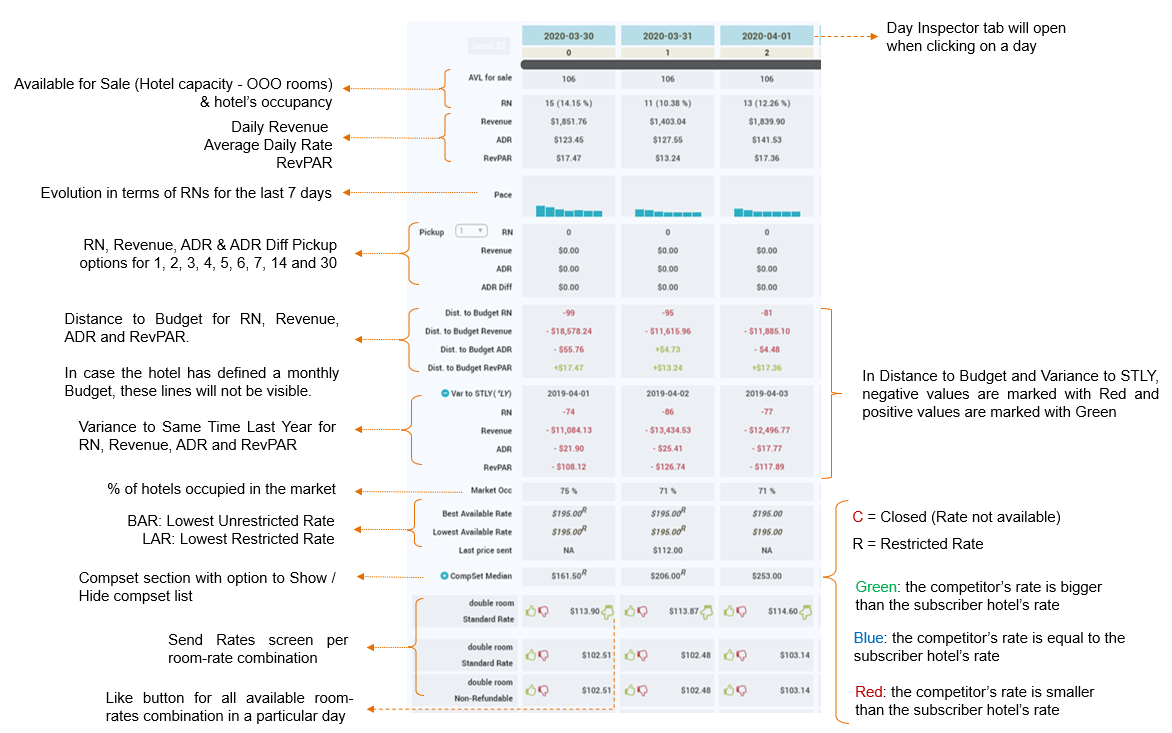
Dashboard > Daily View tab
On this tab the user will find data for the reference date and the next 31 future days, loaded by default. The period can be customized using the general date picker.
Data displayed in this screen includes the most important KPIs, market data and the reco rate:
- Rooms available for sale
- Occupancy
- Revenue
- ADR
- RevPAR
- Pickup: RN, Revenue, ADR, ADR Diff
- Distance to Budget / Forecast: RN, Revenue, ADR, RevPAR
- Variance to STLY / LY: RN, Revenue, ADR, RevPAR
- Market occupancy
- Best Available Rate & Lowest Available Rate
- Competitor’s rates & Compset Median
- Last Price Sent
- Recommended Rate
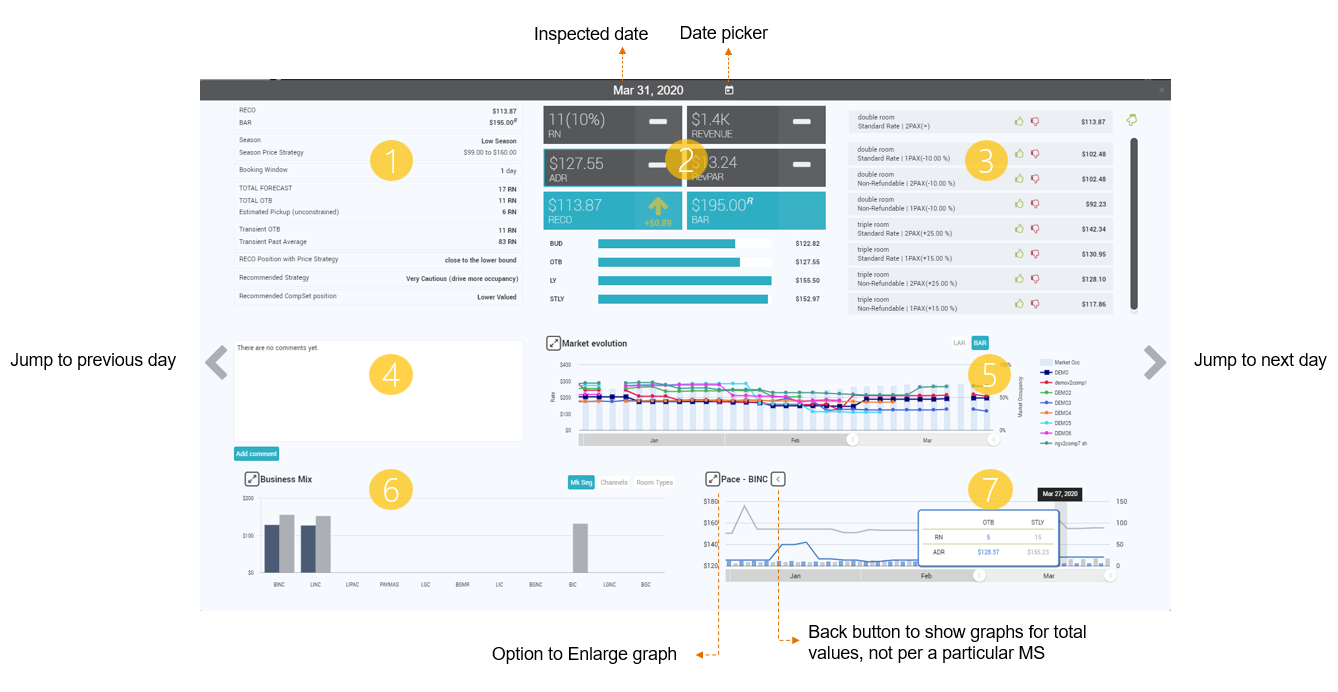
Day Inspector
Day Inspector screen includes the following:
- Details about the Recommended Price
- Main KPI’s of the day
- Recommended Price section. Includes the recommended rate for room-rate dependencies
- Comments Field available for adding Internal and External comments. External comments are also sent via e-mail
- Compset rate and Market Occ evolution. Option to display BAR or LAR rates
- Business Mix per MS, Channels and Room types. When clicking on a particular Market Segment, the Pace graphs loads values for that Market Segment. Back button is used to show again the Pace graph for total values.
- PACE for the selected KPI and segment
Note: Business Mix and Pace Graphs show data depending on the Main KPI selected / Market Segment Selected
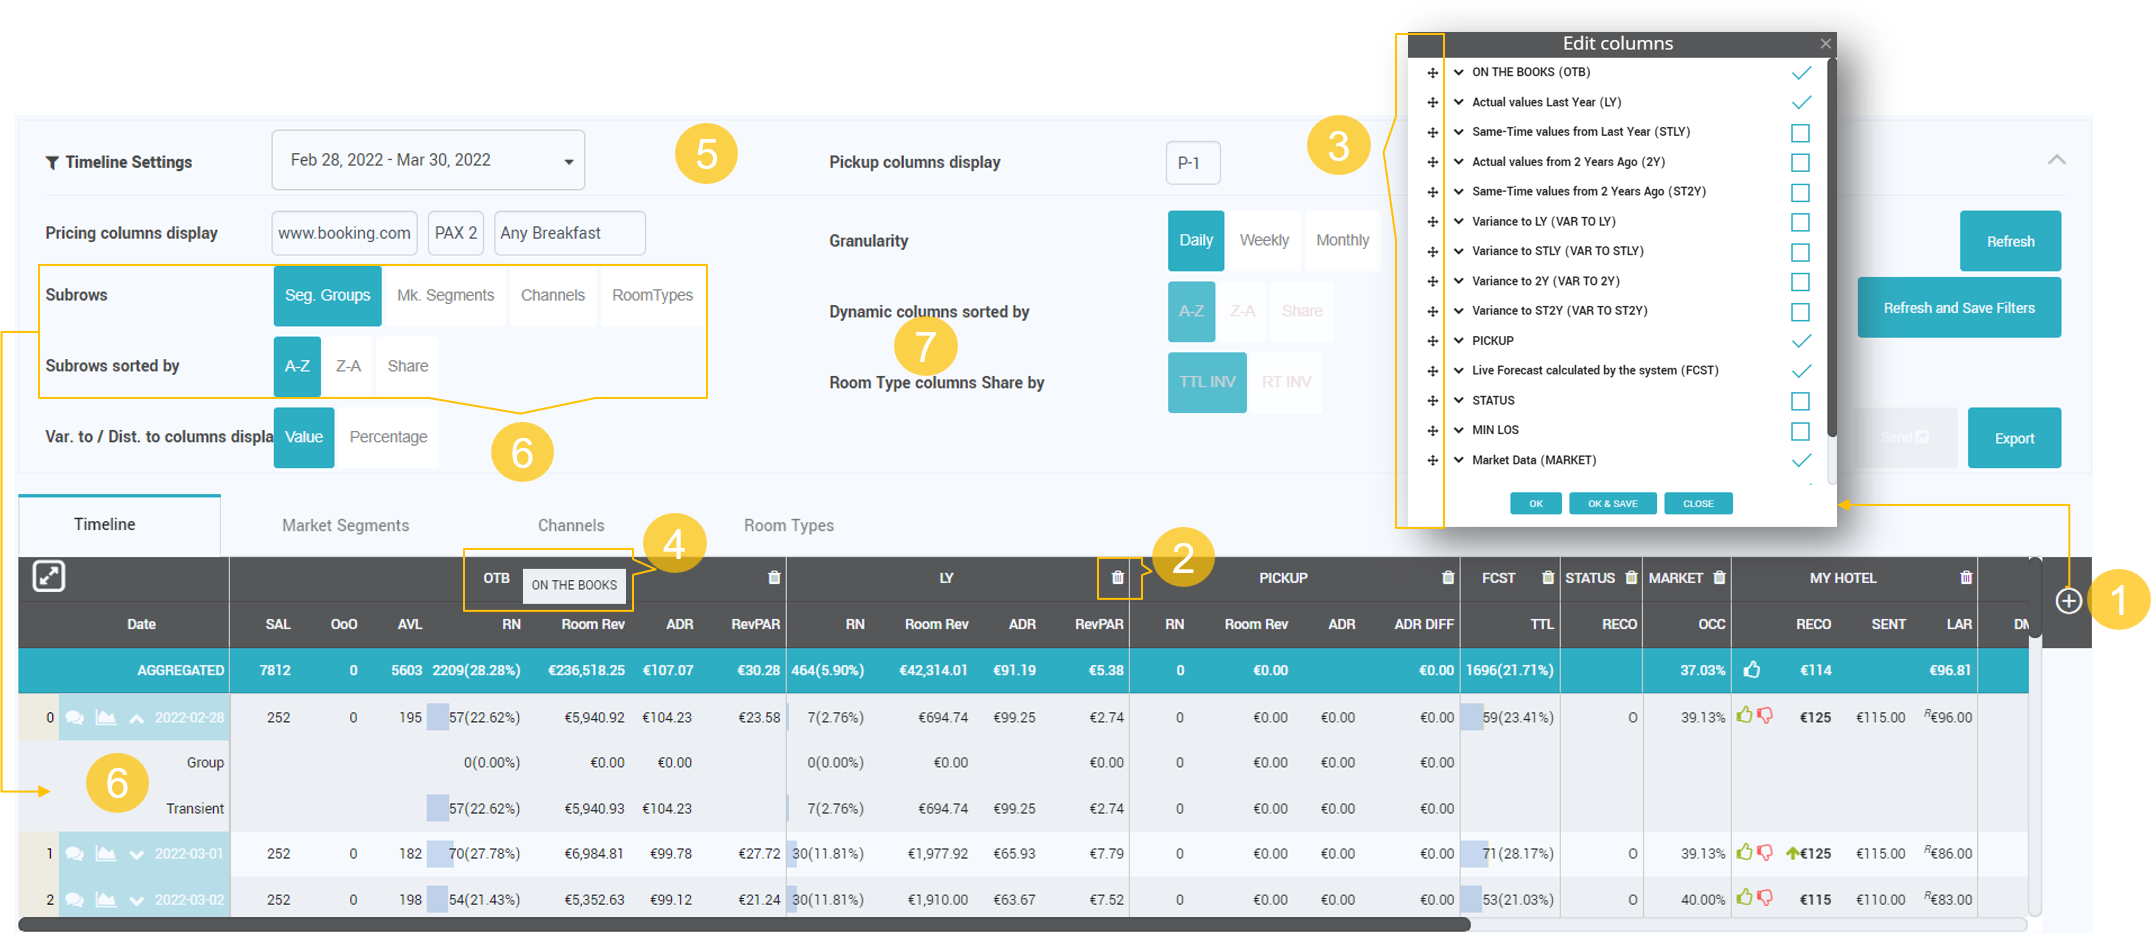
Timeline > Daily granularity
In Timeline screen, there are several KPIs that can be seen:
- Room Nights
- Revenue
- ADR
- RevPAR
The above KPIs are in the following categories: On the Books values, Actual Values for Last Year, Same Time values for Last Year, Actual values from 2 years ago, Same Time values for 2 years ago, Variance to Last Year, Variance to STLY, Variance to 2 years ago, Variance to same time 2 years ago.
- Pickup for RN, Room Revenue, ADR for picked up business, ADR difference (Difference in ADR before and after pickup).
Other information is available in addition to the above KPIs: Live Forecast calculated by the system, MinLos and Open / Close Recommendations, Market Occupancy and Compset Rates, Recommended Rate for the Reference Room Type, Last price sent, Lowest available rate found online.
Timeline screen details for image below are as follows:
- To add or remove columns, the edit button is used (+). When clicking the (+) button, the “Edit Columns” popup opens.
- The user can hide columns (similar to the pickup report).
- The order of the columns can be changed using the “Edit Columns” feature (drag and drop).
- The columns have “short” and “long” names. The timeline columns display the short name and on mouseover the long name. The Edit popup display both short and long names, in this format: “Long name (short name)“.
- The entire upper horizontal space next to “Timeline Settings” is clickable to open and close the filter menu.
- The user can add data displayed in Timeline as sub rows. The available data is per Segment Group / Market Segments / Channels / Room Types and will be added to each row. Data displayed for these rows can also be sorted: A-Z, Z-A or per Share.
- “Dynamic columns sorted by” filter is available only for Market Segments / Channels / Room Types Tabs. “Room Type columns Share by” is available only for Room Types tab.