Release Notes – Version 2.12
CONTENT
- Consolidation
- Dashboard
- Timeline
- Custom Reports
- Budget / Forecast
- Alerts Module
- Auto Pilot
- Breaking Changes
CONSOLIDATION
- The following menus were updated to a newer front-end framework: Dashboard, Compset, Channel Value Index, Seasons, Capacity Management, Upload, Compset Mappings. This results in slightly modified design but also provides a more tidy layout, more readability and better performance. Dashboard, Compset and Channel Value Index now have the filters hidden in the Settings bar.
-
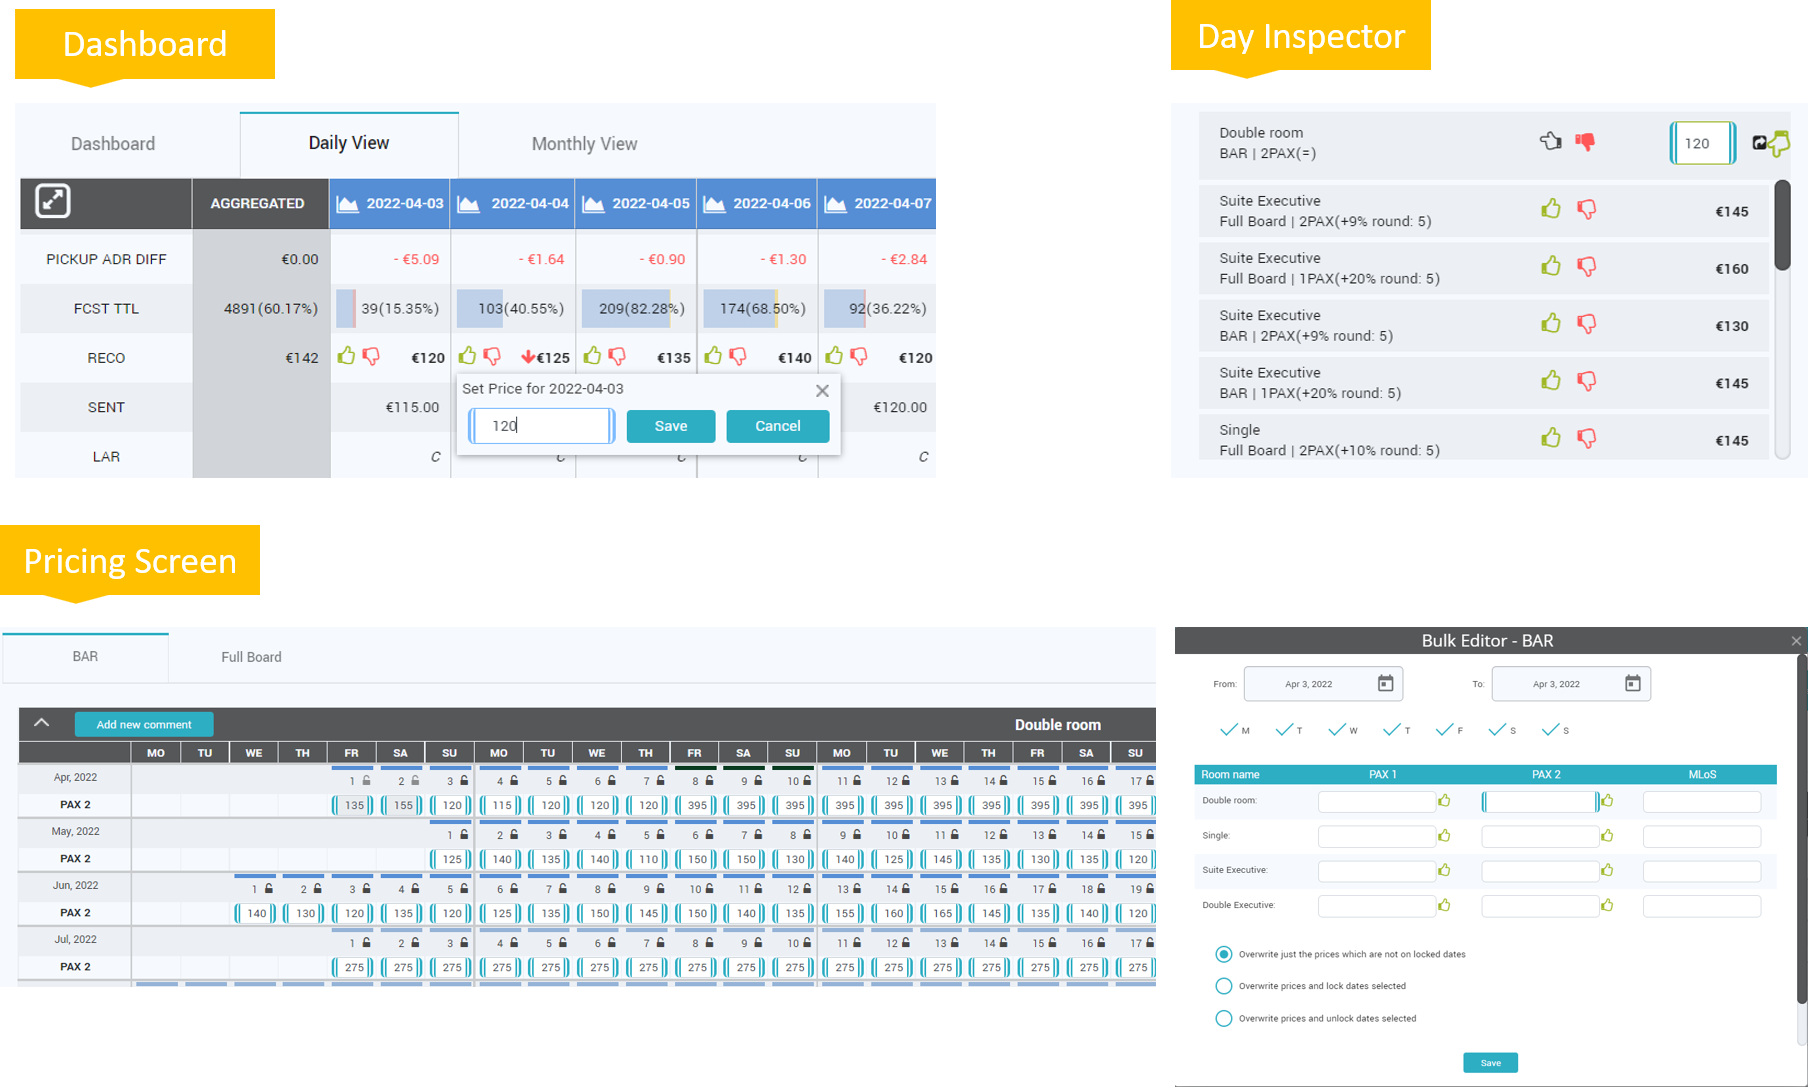
Prices that have not yet been sent by a user who has logged out of the application, reappear when the user logs back in. They will be visible in the Timeline, Dashboard, Pricing – having the “ready to be sent” indicator – and the SEND button active.
- The actual values of MinLOS are now displayed in the New Timeline as well.
- The input field for the reference room/rate price value has a special design (blue double borders) in various parts of the app: Dashboard, Timeline and Day Inspector (after dislike), Pricing screen in Bulk Edit window and Edit Mode.
- In the Timeline report, the competitor’s relation is displayed next to the competitor’s name in superscript style. This design will be introduced everywhere in the app where competitor names are displayed.
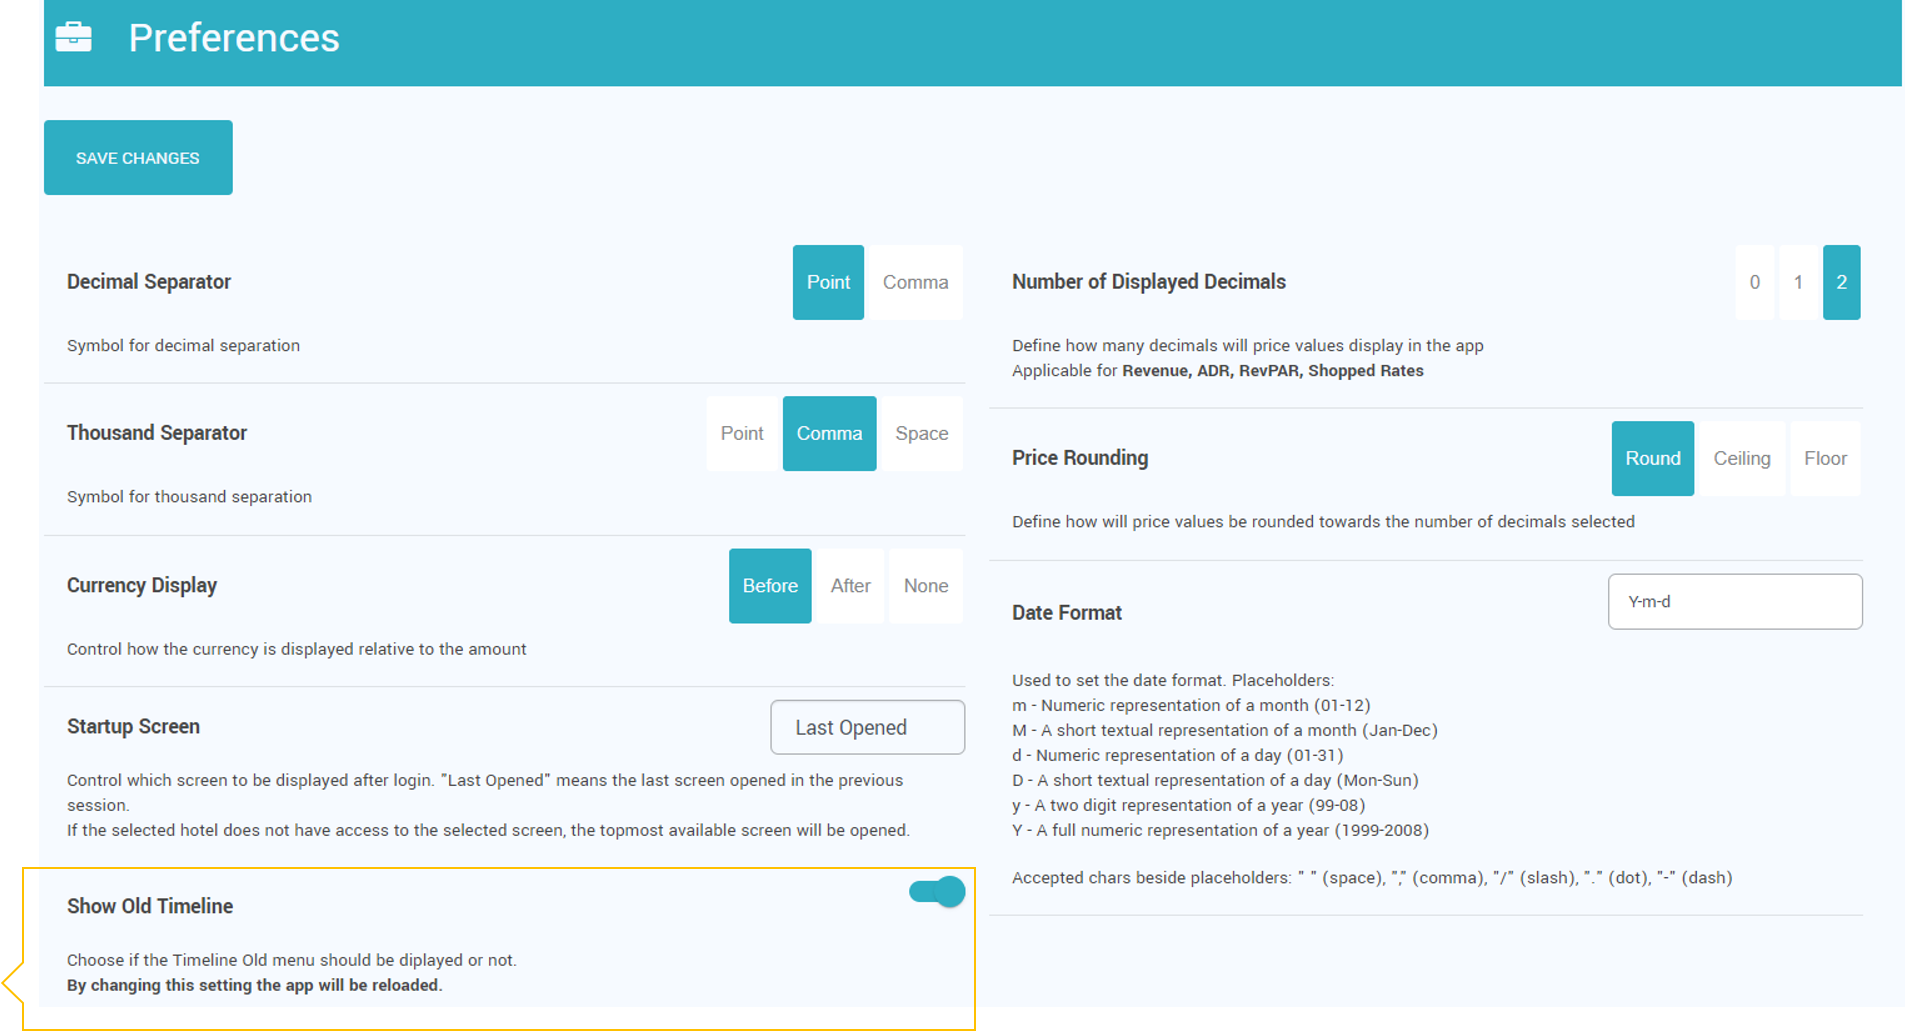
- In the USER PREFERENCES screen, it is possible to choose whether the Timeline Old menu is displayed or not:
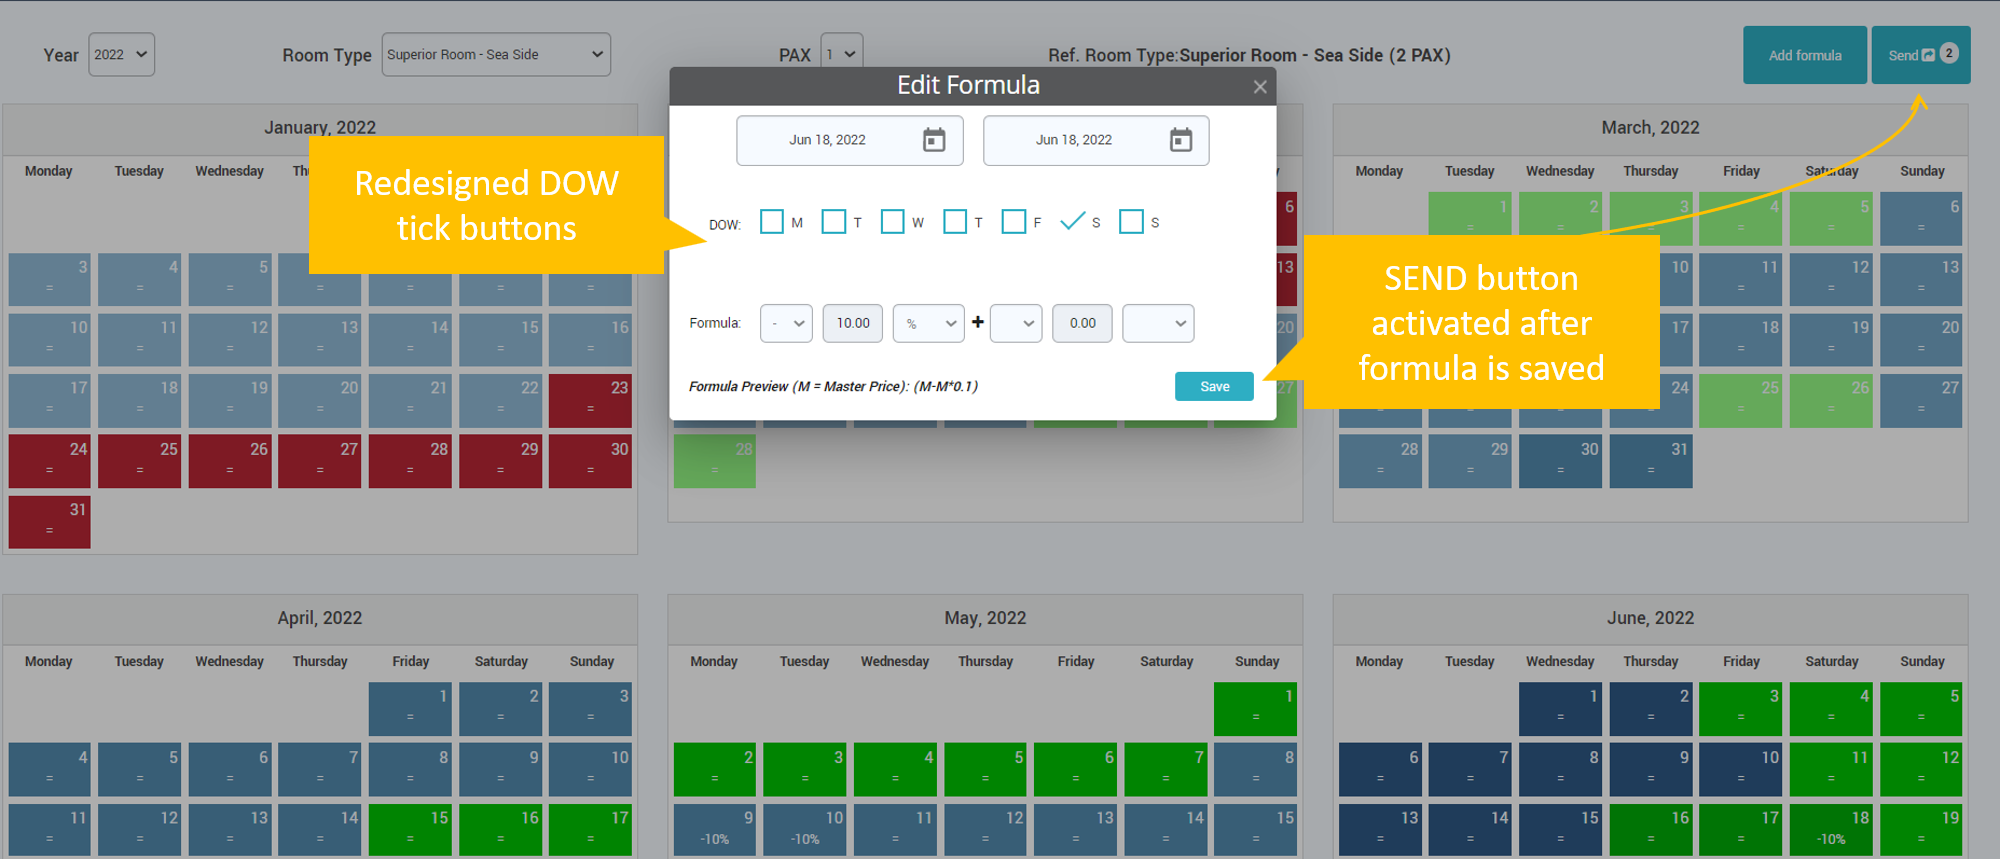
- Price Dependencies Room Types & Rate Plans menus – Add new formula screen: DoW tick buttons were redesigned to match the same theme as the rest of the app.
- SEND button was added in Price Dependency Room Types & Rate Plans menus. Whenever a formula is adjusted or added, the dates affected are marked and can be sent to the Channel Manager / PMS, directly from these menus.
DASHBOARD
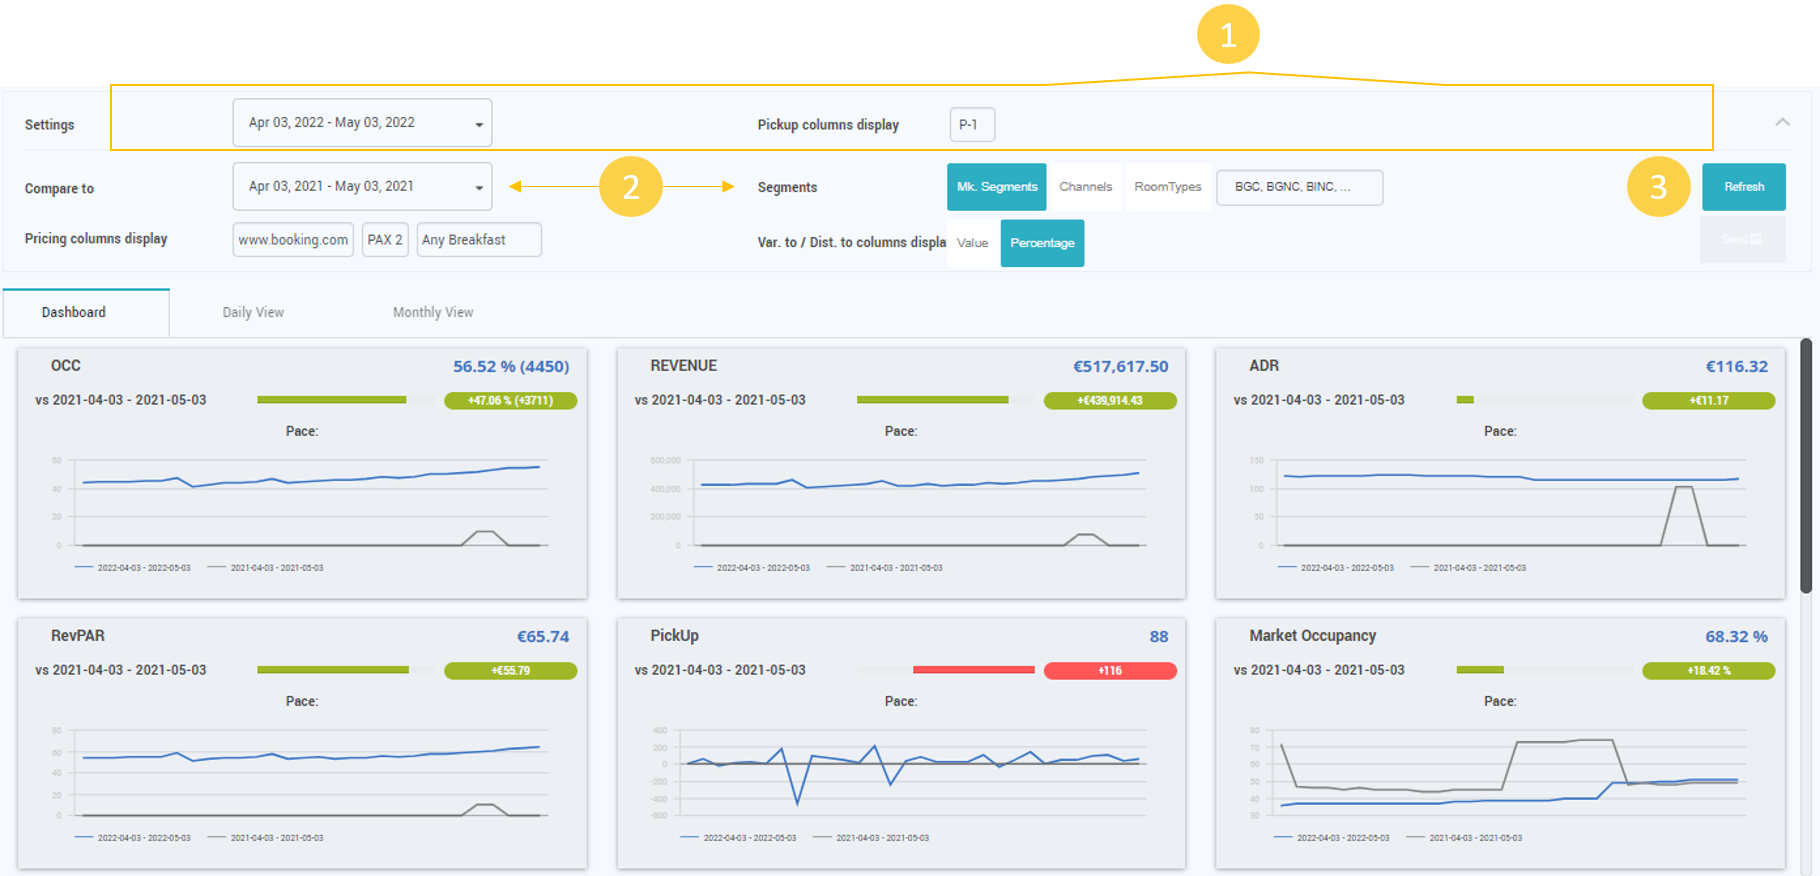
- The entire upper horizontal space next to “Settings” is now clickable to open and close the filter menu. Only the timeframe and pickup fields are always displayed next to the ‘Settings’ label.
- The “Compare to” timeframe and the filter for choosing to display data for particular Market Segments, Channels or Room Types are now visible only after opening the filter section.
- Refresh button is used in order to display the report for the selected filters.
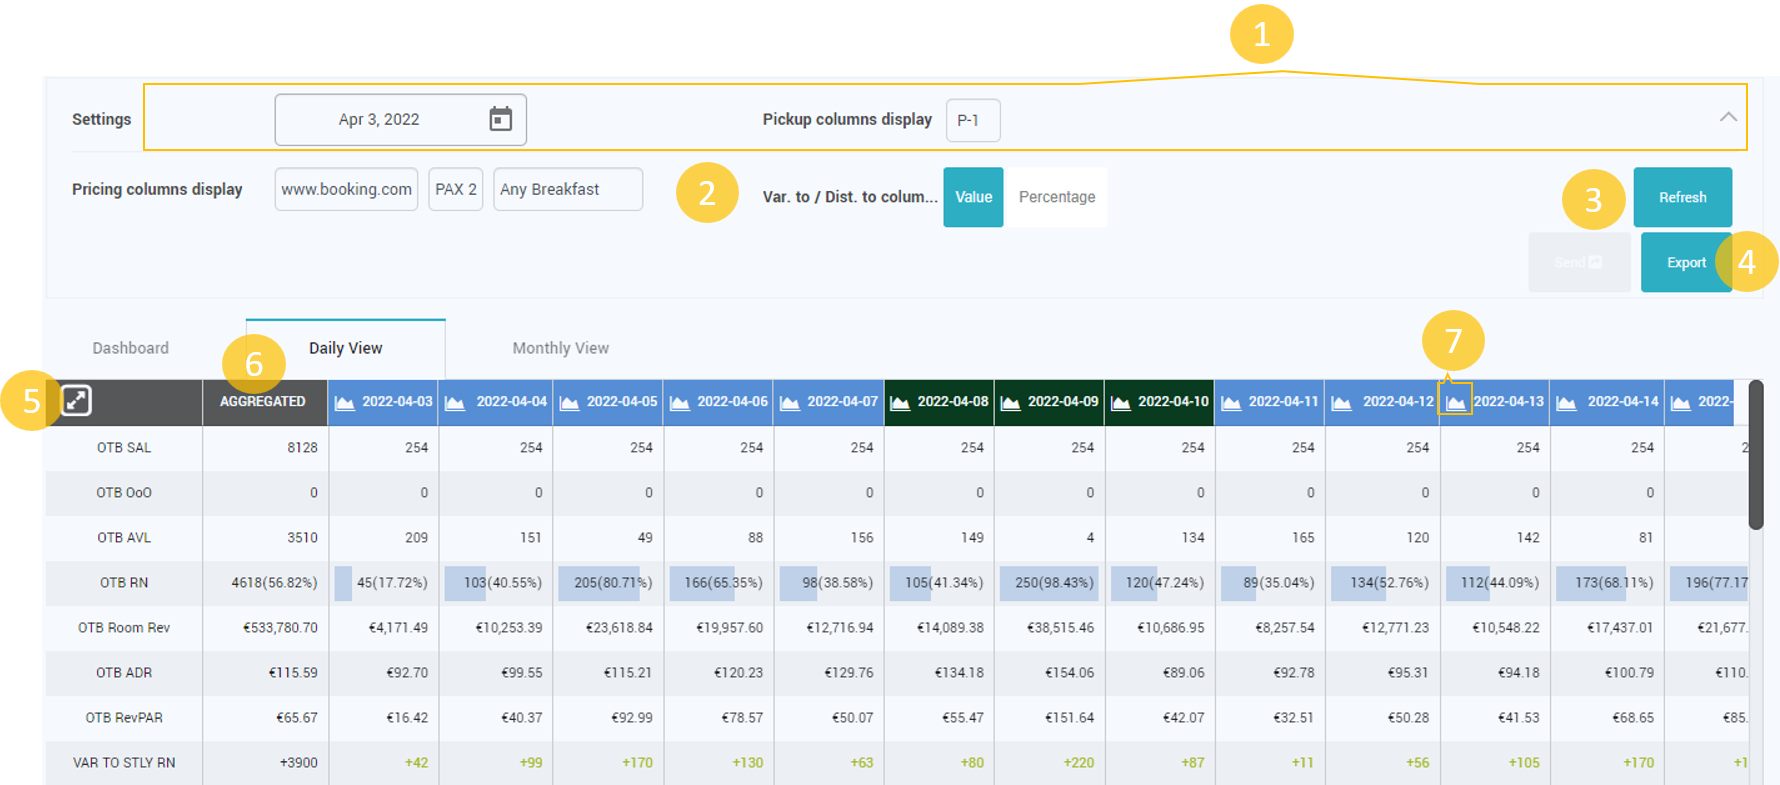
Dashboard > Daily View
- The entire upper horizontal space next to “Settings” is now clickable to open and close the filter menu. The timeframe and Pickup field are pinned to the top bar, next to the ‘Settings’ label.
- The “Pricing columns display” and “Var. to /Dist. To columns” are now visible only after opening the filter section.
- Refresh button is used in order to display the report for the selected filters.
- Export button to export the Dashboard report with the active filters.
- Maximize table to full screen.
- Aggregated data column.
- Open Day Inspector window.
The new dashboard is now more similar to the Timeline report, but displaying daily data horizontally.
Some rows are new, others were excluded. See the comparison below:
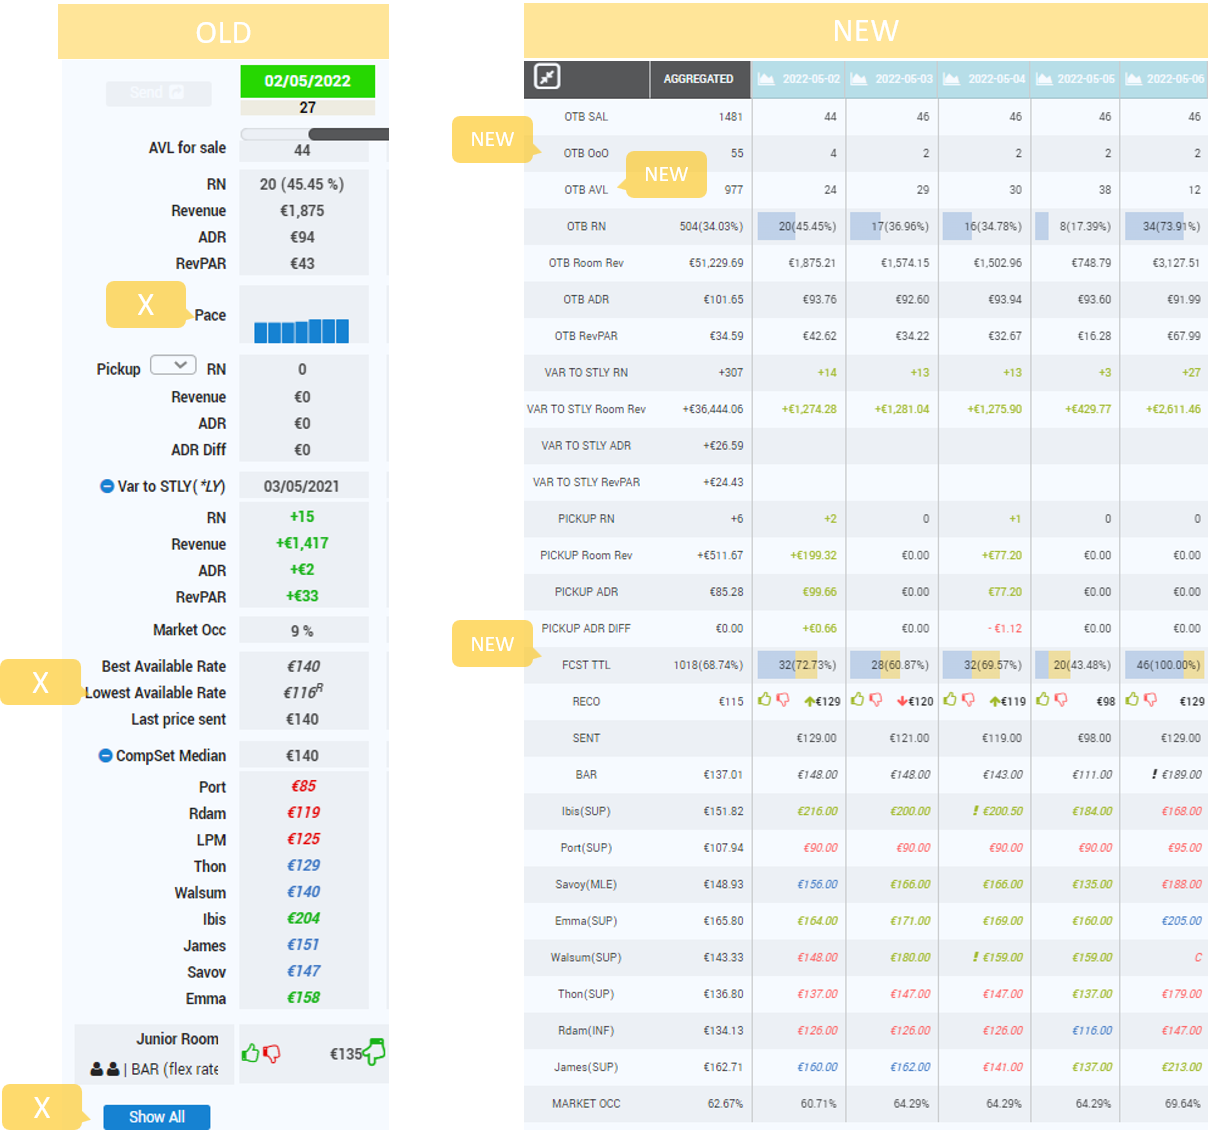
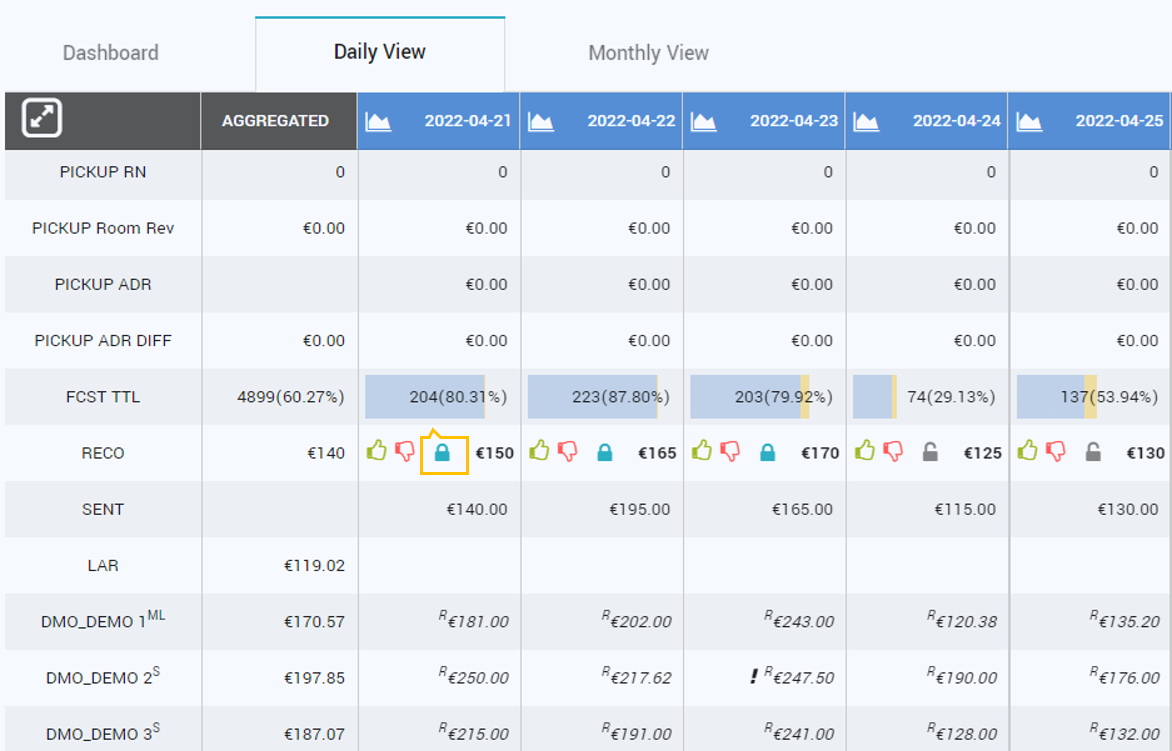
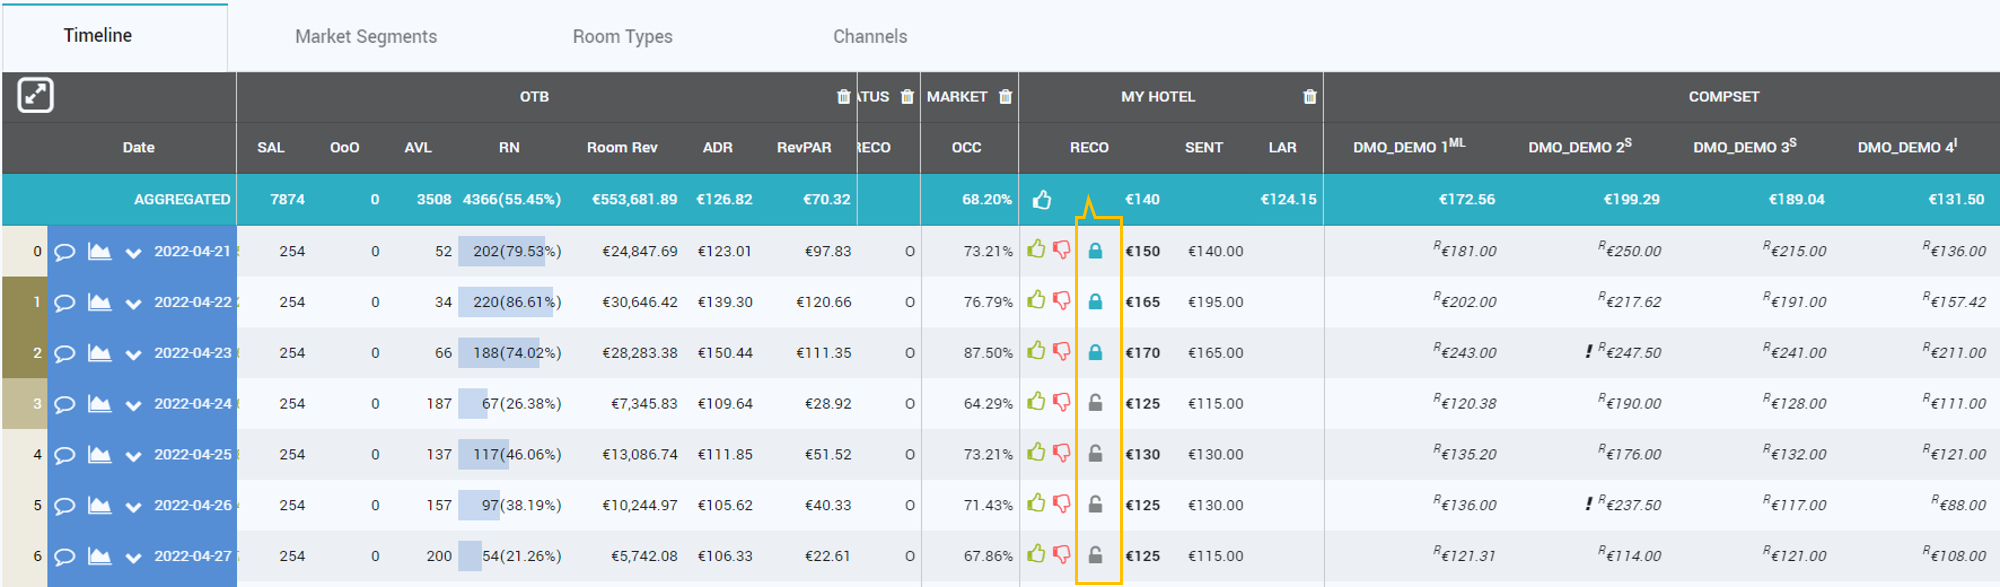
RECO row offers the possibility to lock days for which the price should not be sent. This action is also available in Day inspector.
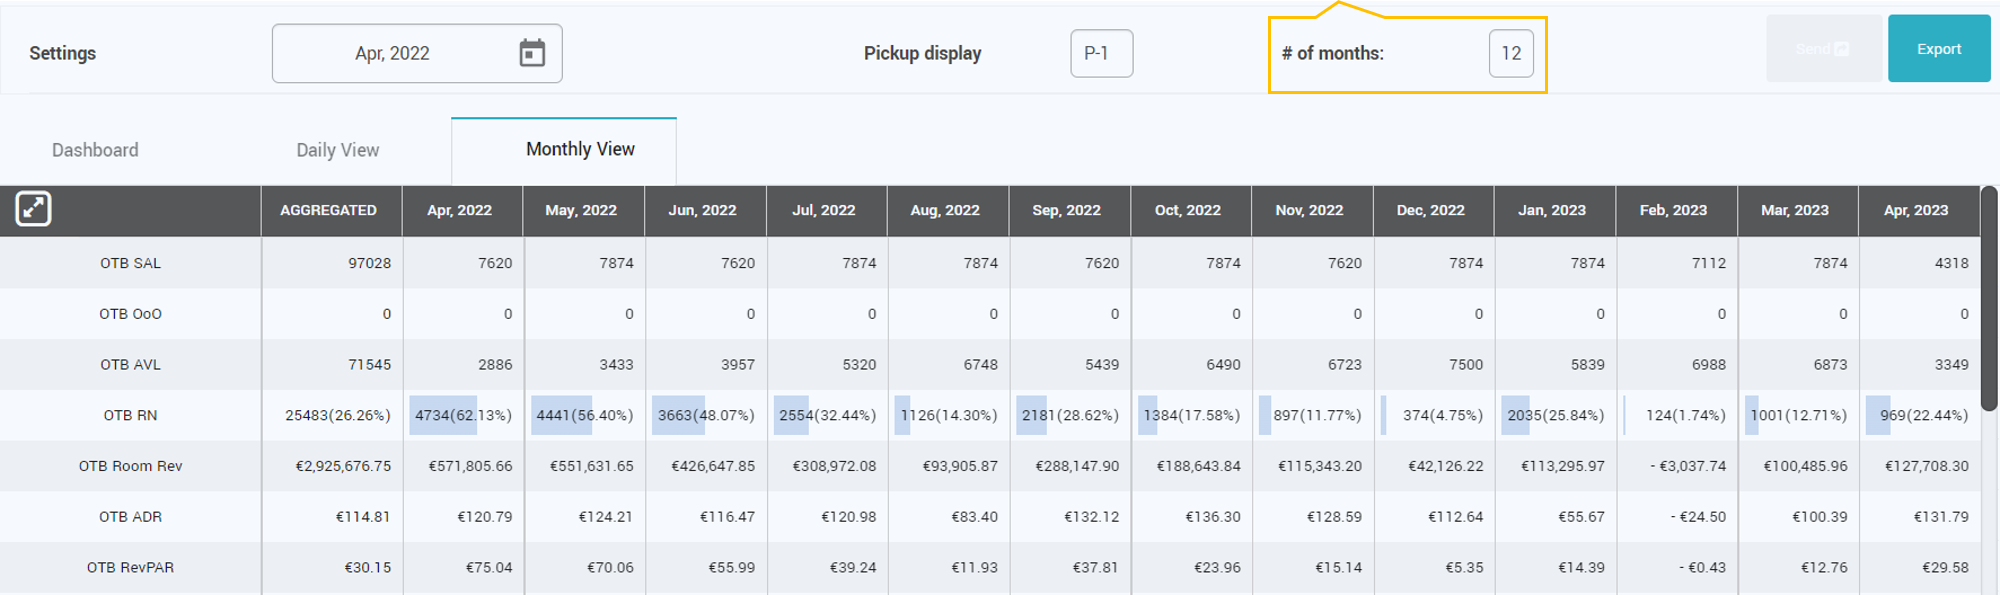
Dashboard > Monthly
There are several changes to the Monthly tab as well:
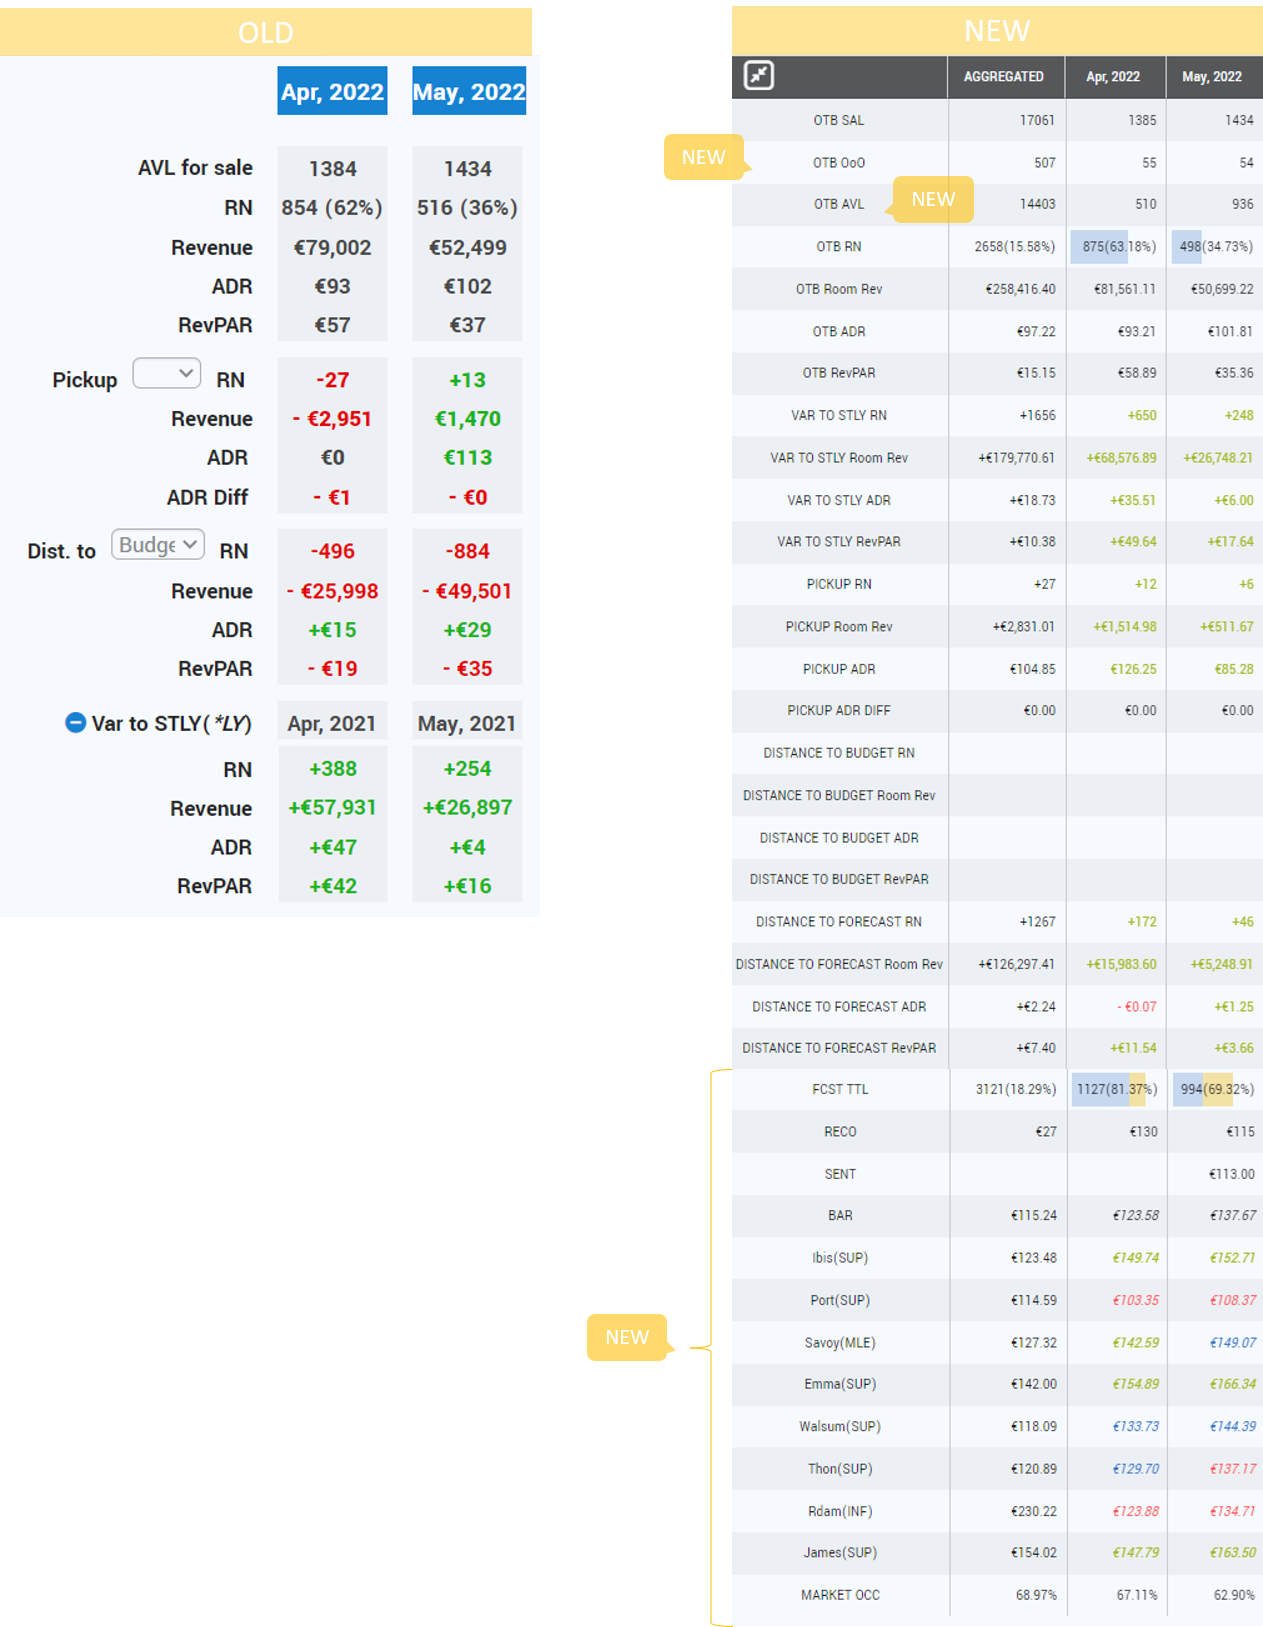
There is the possibility to define the maximum number of months that are loaded:
TIMELINE
- The possibility to uncheck all options in Edit Columns was blocked.
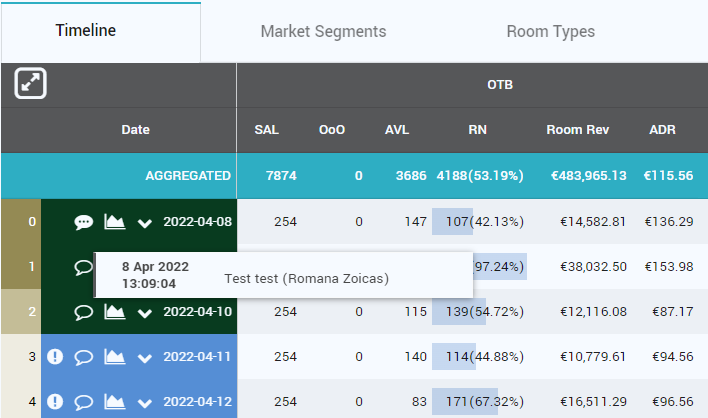
- The comments icon has changed. The bubble icon is filled for dates in which a comment has been added (otherwise it has an empty design):
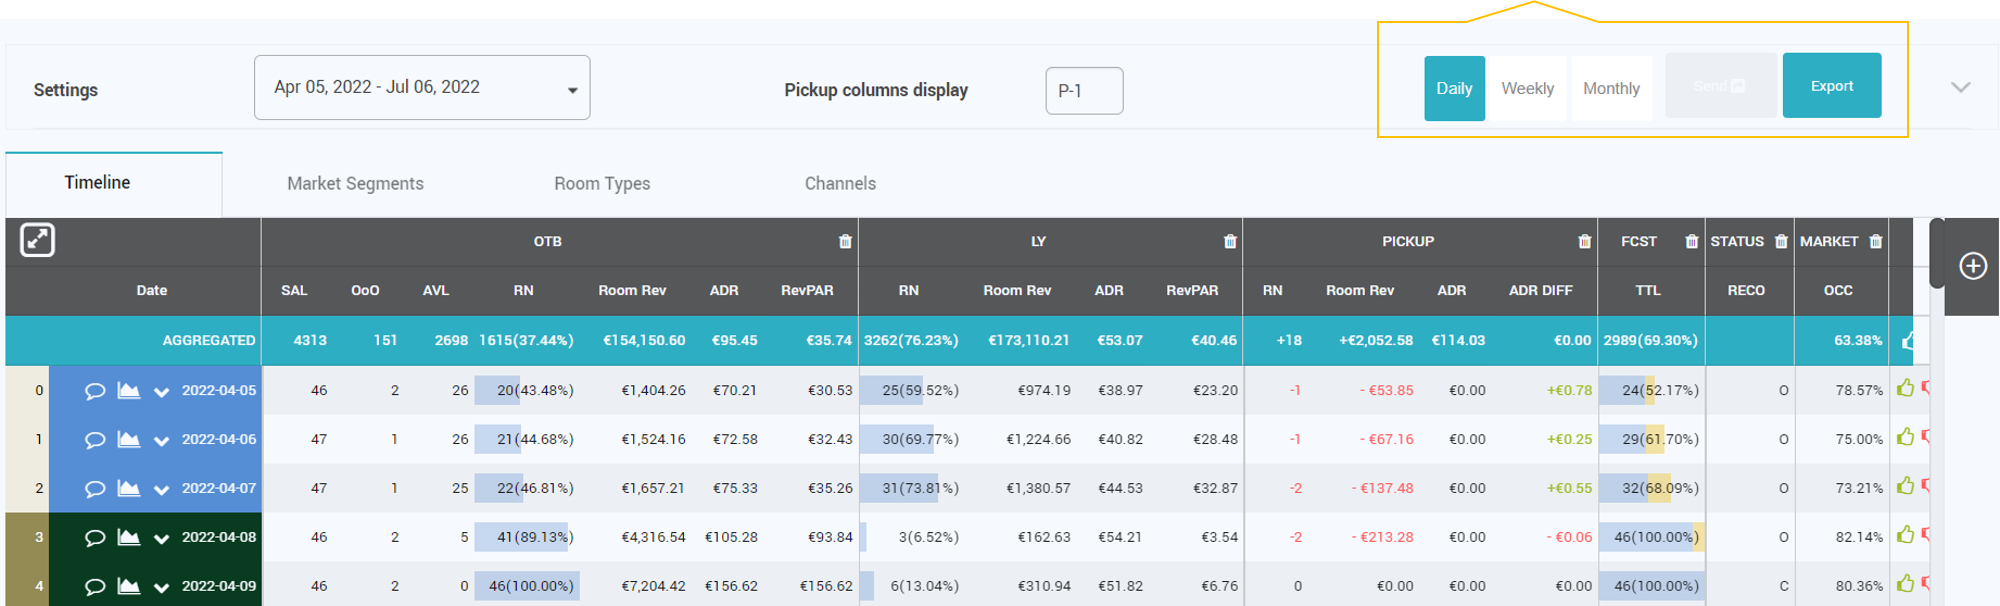
- Granularity filter is now on the top bar, in line with date picker and pickup selection:
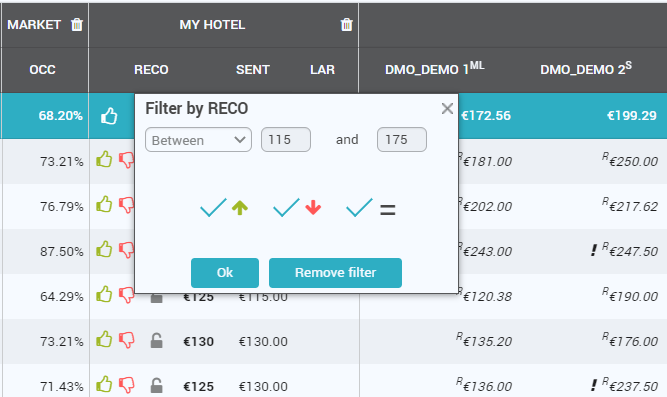
- The RECO filter has been improved. The user can now filter by “RECO change”; Green arrow for increase, red arrow for decrease and “=” for no changes:
- Days can now be locked from Timeline as well:
CUSTOM REPORTS
New functionality, available by default only to Key Admin users.
With this functionality, the user now has the possibility to create custom reports.
A Custom Report is created in 3 Steps.
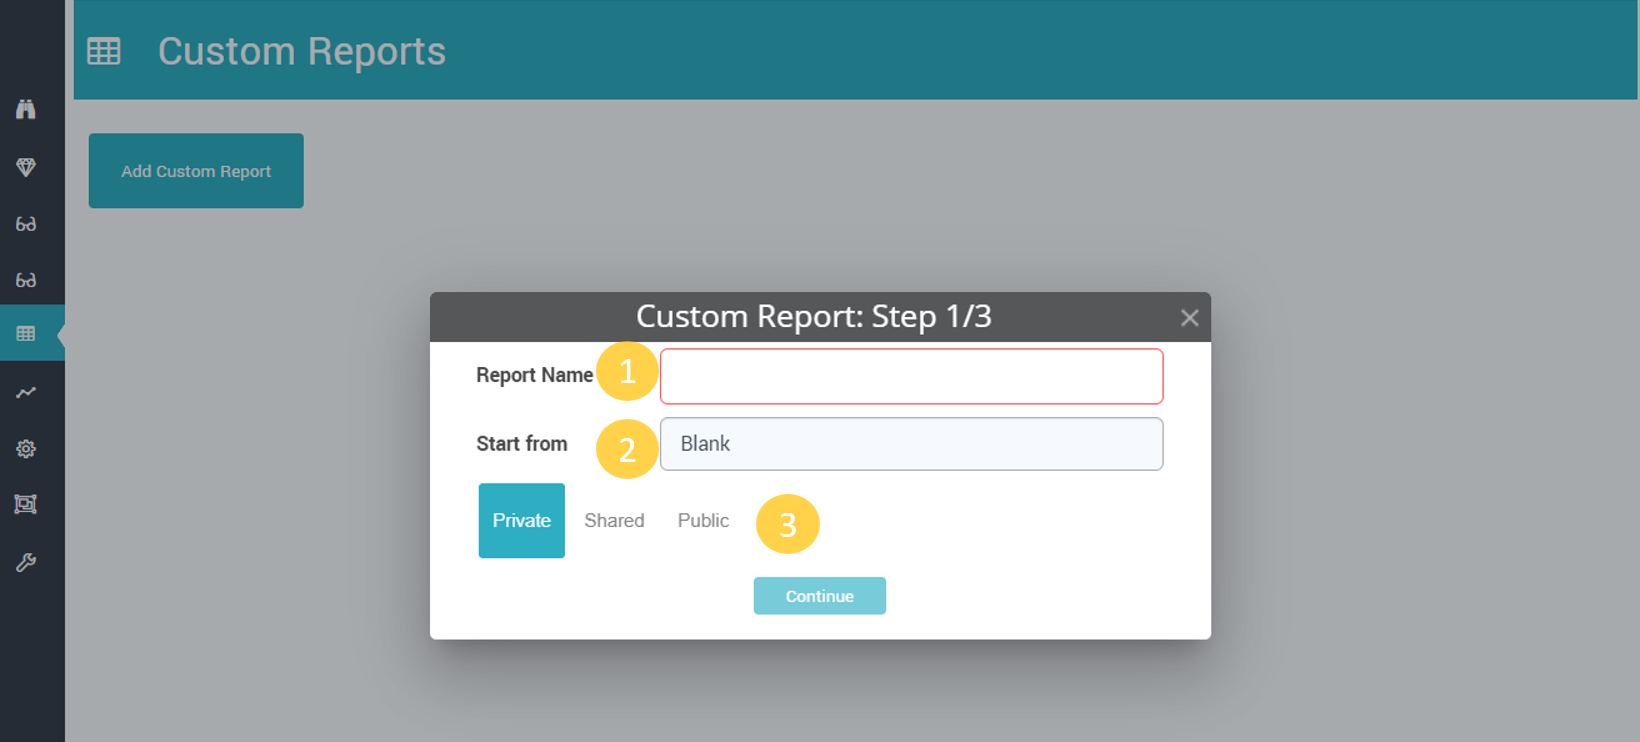
1st Step
- Define the Name of the Report.
- Select if the custom report should use as base a preexisting report. When selecting to start from a pre-existing Custom Report, the 2nd step is skipped and all parameters are copied from the pre-existing report. The user is taken directly to the Column definition in step 3 where all columns are already selected as in the pre-existing report. From there, the user can change the columns and also go back to the report parameters screen (step 2), now being able to change them.
- The report can be “Private” (visible only to the user who creates the report), “Shared” with a user he created or the parent user, or it can be “Public” (visible to all users).
2nd Step
The user has to define the following parameters:
- Default Timeframe of the report and if changes in Settings Area (filters) should be possible or not. Bu default, the Timeframe is the one defined in the general Settings area.
- Default Granularity and if changes in Settings Area (filters) should be possible or not.
- Second Dimension and if changes in Settings Area (filters) should be possible or not. This parameter defines if sub-rows will be used (similar to sub-rows in Timeline).
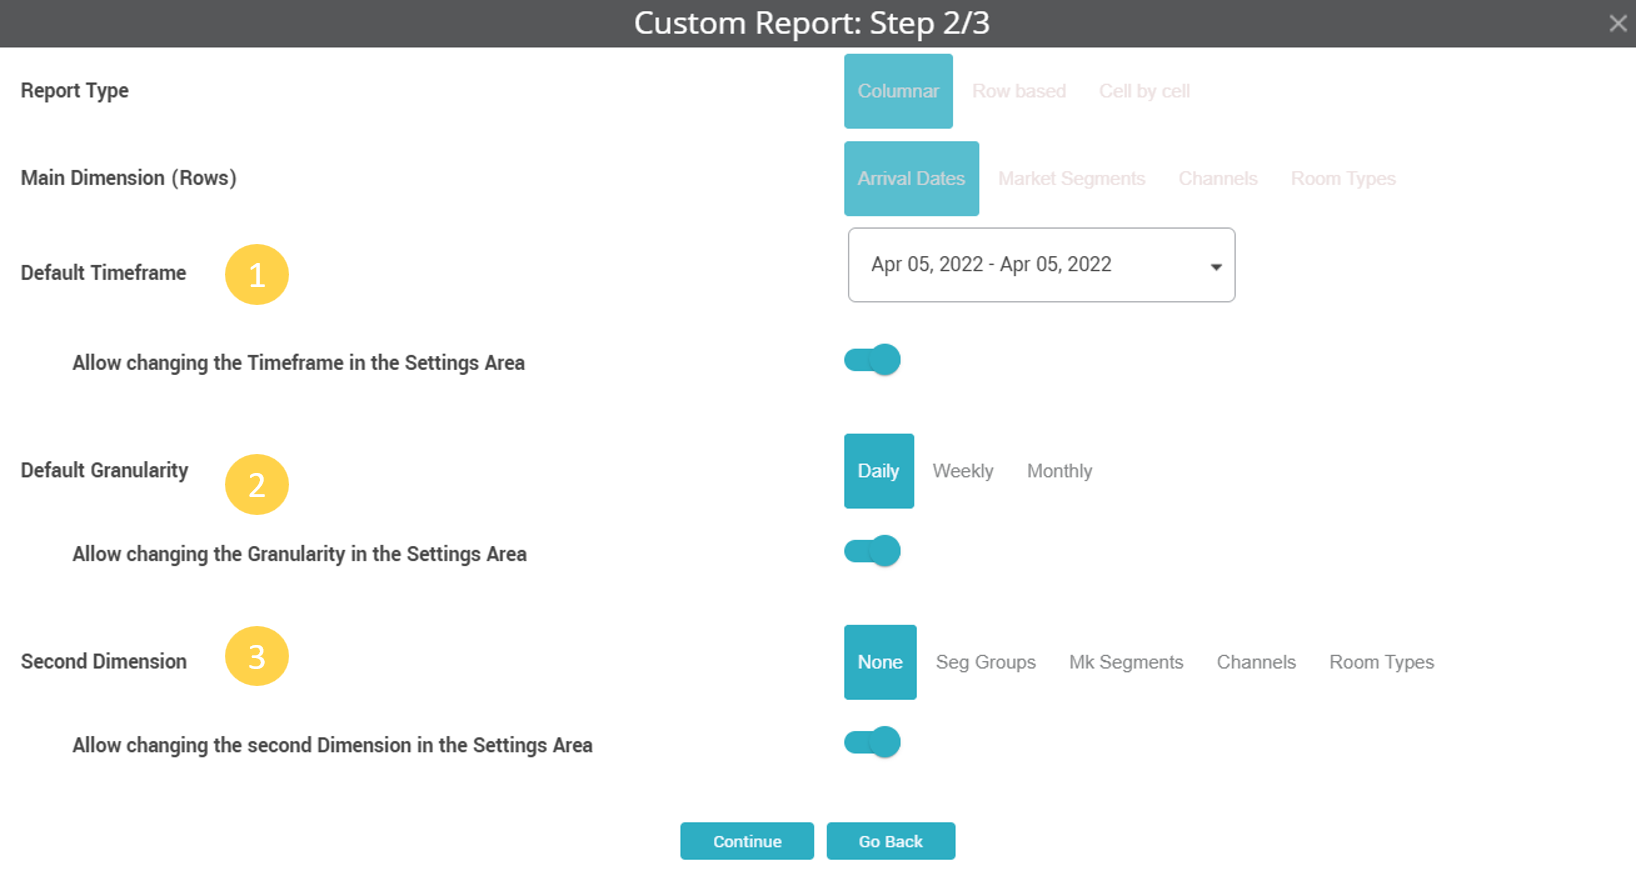
NB: Report Type and Main Dimensions (rows) cannot be edited in this version.
When coming from a blank template, the parameters are prefilled as above.
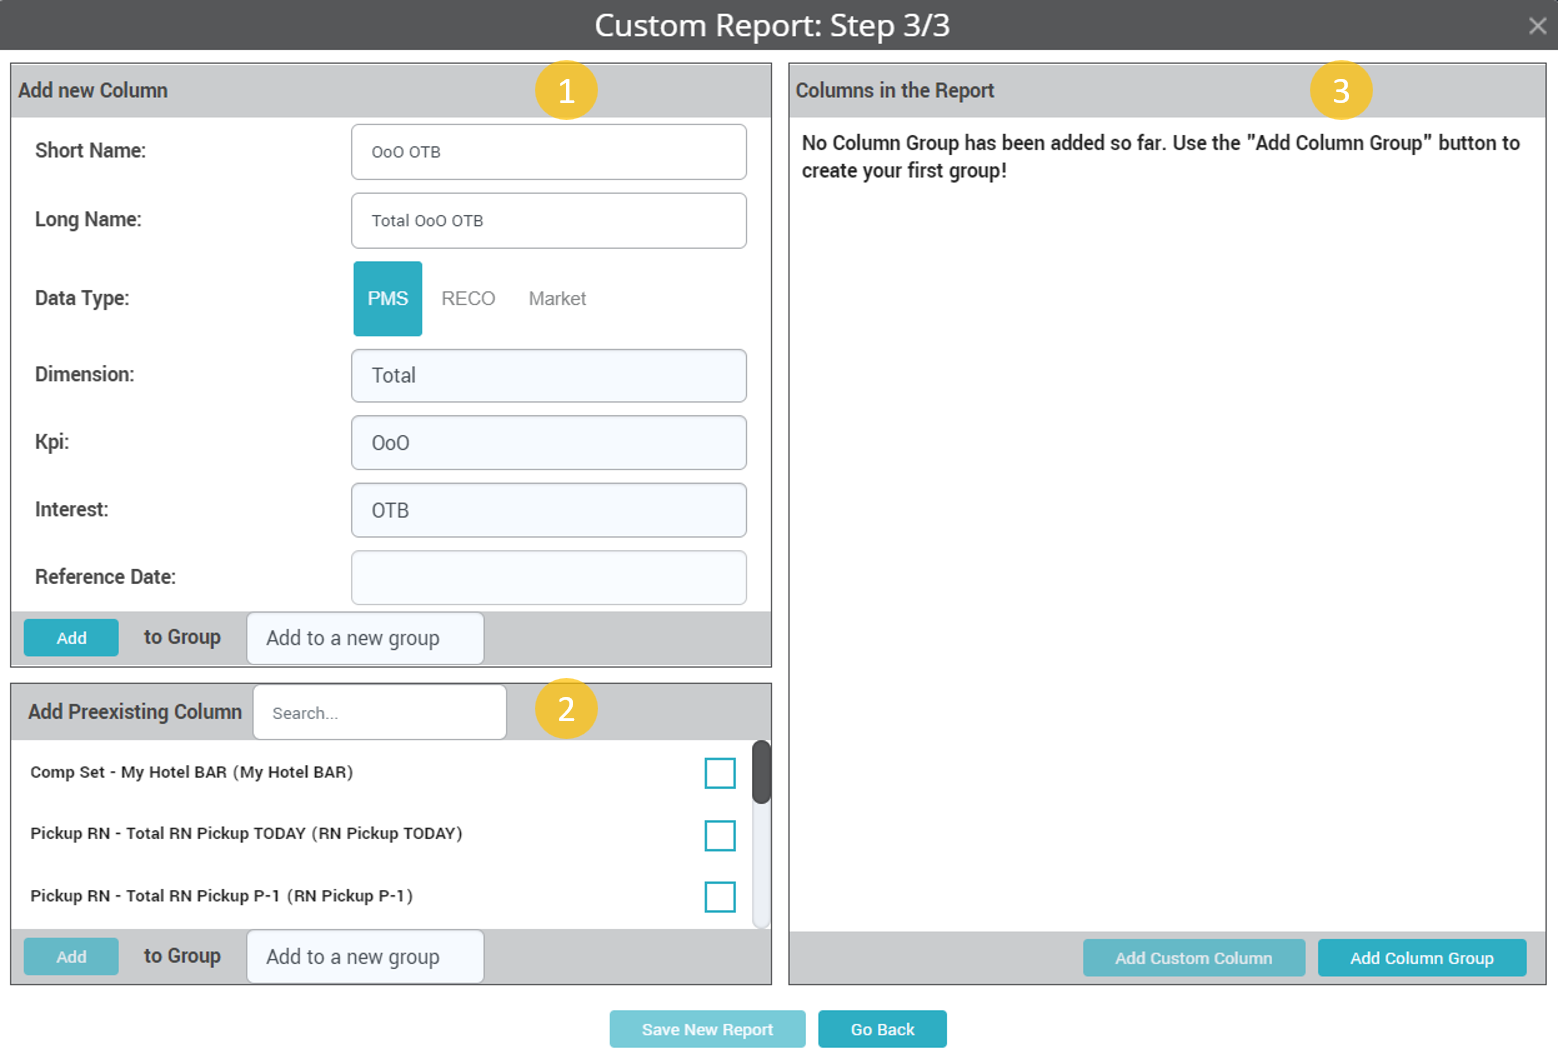
3rd Step
Column Groups are created and managed here. There are 3 sections inside this step.
- Add new column – in this section the user can define a type of column based on the variety of parameters. The Columns can have PMS data, RECO data (RECO rate, SENT rate etc.) or Market Data (LAR / BAR rate shopped for a particular PAX, on a particular Channel and Market Occupancy).
- Add preexisting column – the columns that already exist in the app’s reports or a column from a custom report previously created are listed here. There is a search option helping the user to find the desired column more easily.
- Columns in the Report – this section will show the columns that are added to the custom report. Column groups must be added here, before adding any column from section 1 and 2. The columns and column groups can be Edited, Deleted or Hidden. When deleting a group, all columns from that group are also deleted. Columns can move from one group to another and no column can exist at top level, meaning they must be inside one group or another.
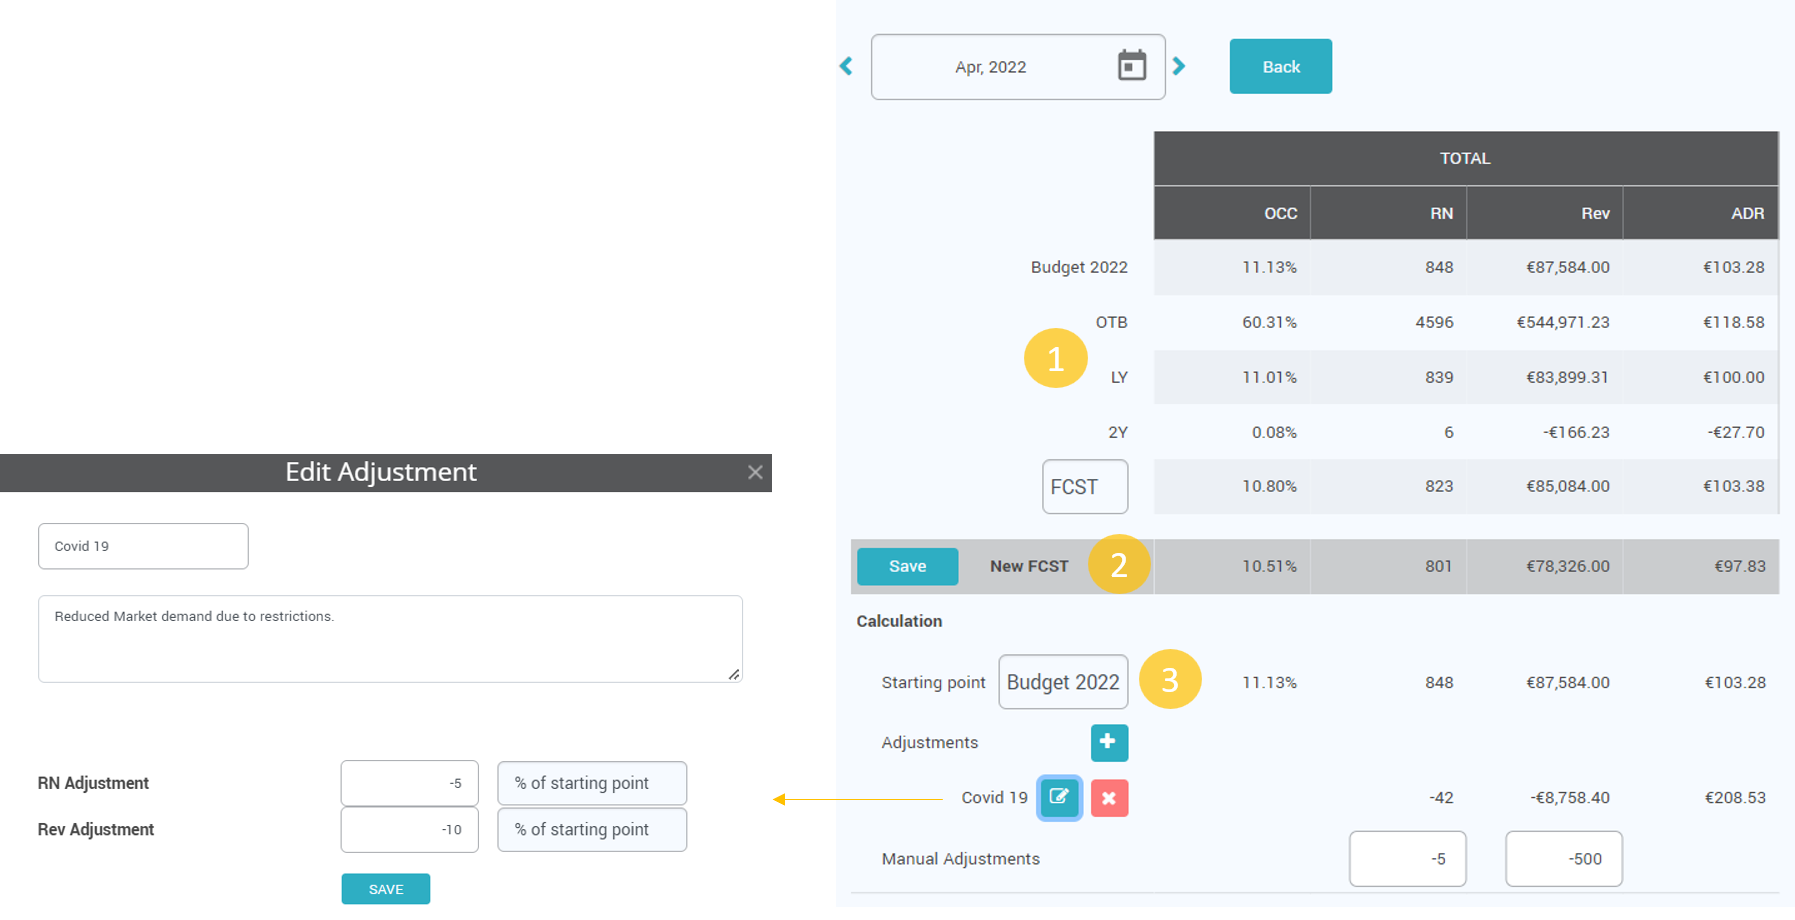
BUDGET / FORECAST
An overhaul of the Edit Budget / Forecast page was made.
A new parameter in Settings will control which KPI is editable in the Budget / Forecast section (ADR or Revenue).
There are three sections in the Edit Budget / Forecast screen:
- Actual values
- New FCST
- Calculation settings
Actual Values Section
This section displays actual data for OCC, RN, Rev and ADR.
The first row in actual values section will display either the Budget, if there is one set for the year, or the available FCST drafts, if no Budget was defined yet.
The dropdown from this section lists the following: “FCST”, “STLY“, “ST2Y”, “P-1, P-2….P-30”.
New FCST section
Contains the SAVE button and the calculated amounts defined in below Calculation section.
In case of Budget defined per Market Segments, the SAVE button is only active when the values for TOTAL RN and REV equal the sum of values for all Market Segments.
Calculation section
In this section the user can make several adjustments to the Forecast.
“Starting point” is the parameter which defines the values on which the adjustments will be applied. Starting Point dropdown options are: “EMPTY”, “BUDGET” (if there is a budget saved or the list of drafts if no budget is defined yet), “OTB”, “LY”, “2Y”, “FCST”.
Each subsequent adjustment will be applied to the initial value of the starting point (not to the calculated subtotal). This means that the order of the adjustments is irrelevant.
Each adjustment added has a name, information and the RN and Rev adjustment values that can either be % of starting point or a definite value. Adjustments saved can be edited or deleted.
Manual adjustments is the row where non specific adjustments can be added or final adjustments can be entered (e.g. to make sure the TOTAL values equal the sum of Market Segments).
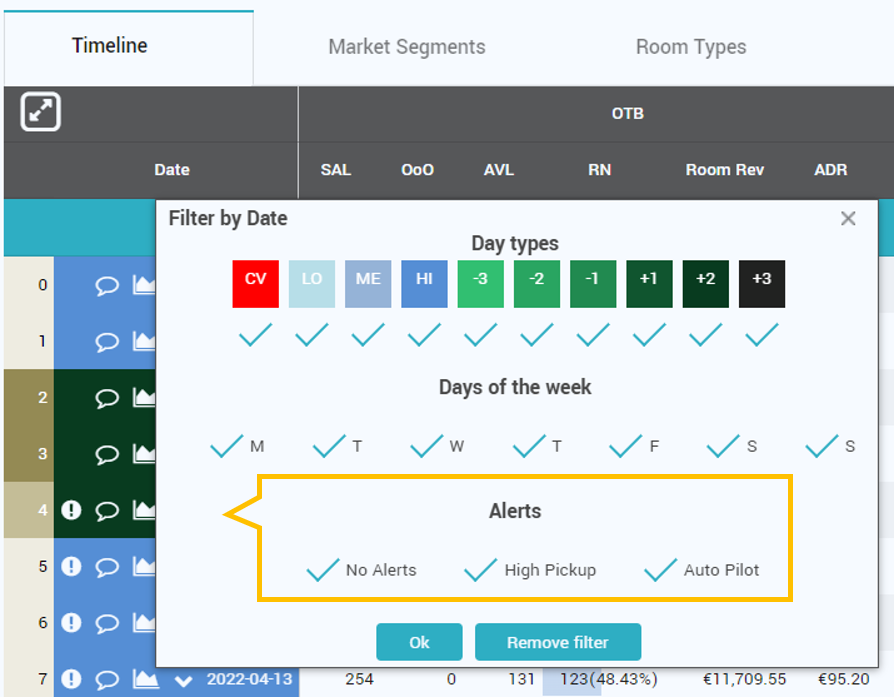
ALERTS MODULE
Alerts Module replaced the High Pickup Report. The alerts can now be seen in the Timeline Report and in Custom Reports, pointing the dates that have pickup values outside the defined values in Settings > Pickup Alerts. Details are displayed at mouse over.
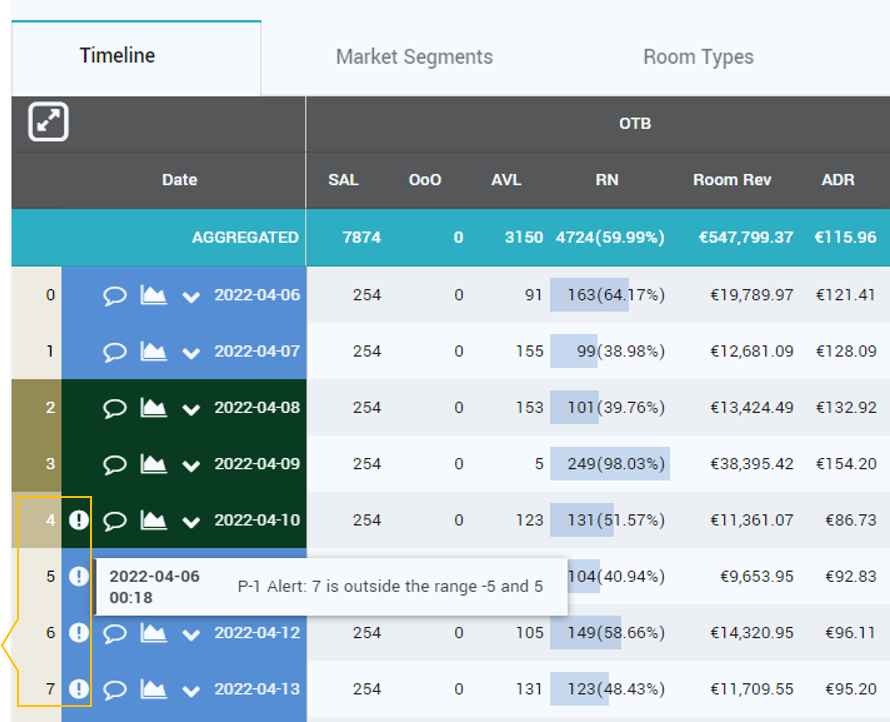
Date filtering from various reports now includes the option to display only days with alerts. This means that filtering the Timeline based on “High Pickup Alerts” will yield the same data as the removed “High Pickup Screen”.
SETTINGS
A new section called “RECO Participation” in Settings – Competitors.
This setting allows the user to set which competitor should be taken into consideration when the RECO rate is calculated and to what extent.
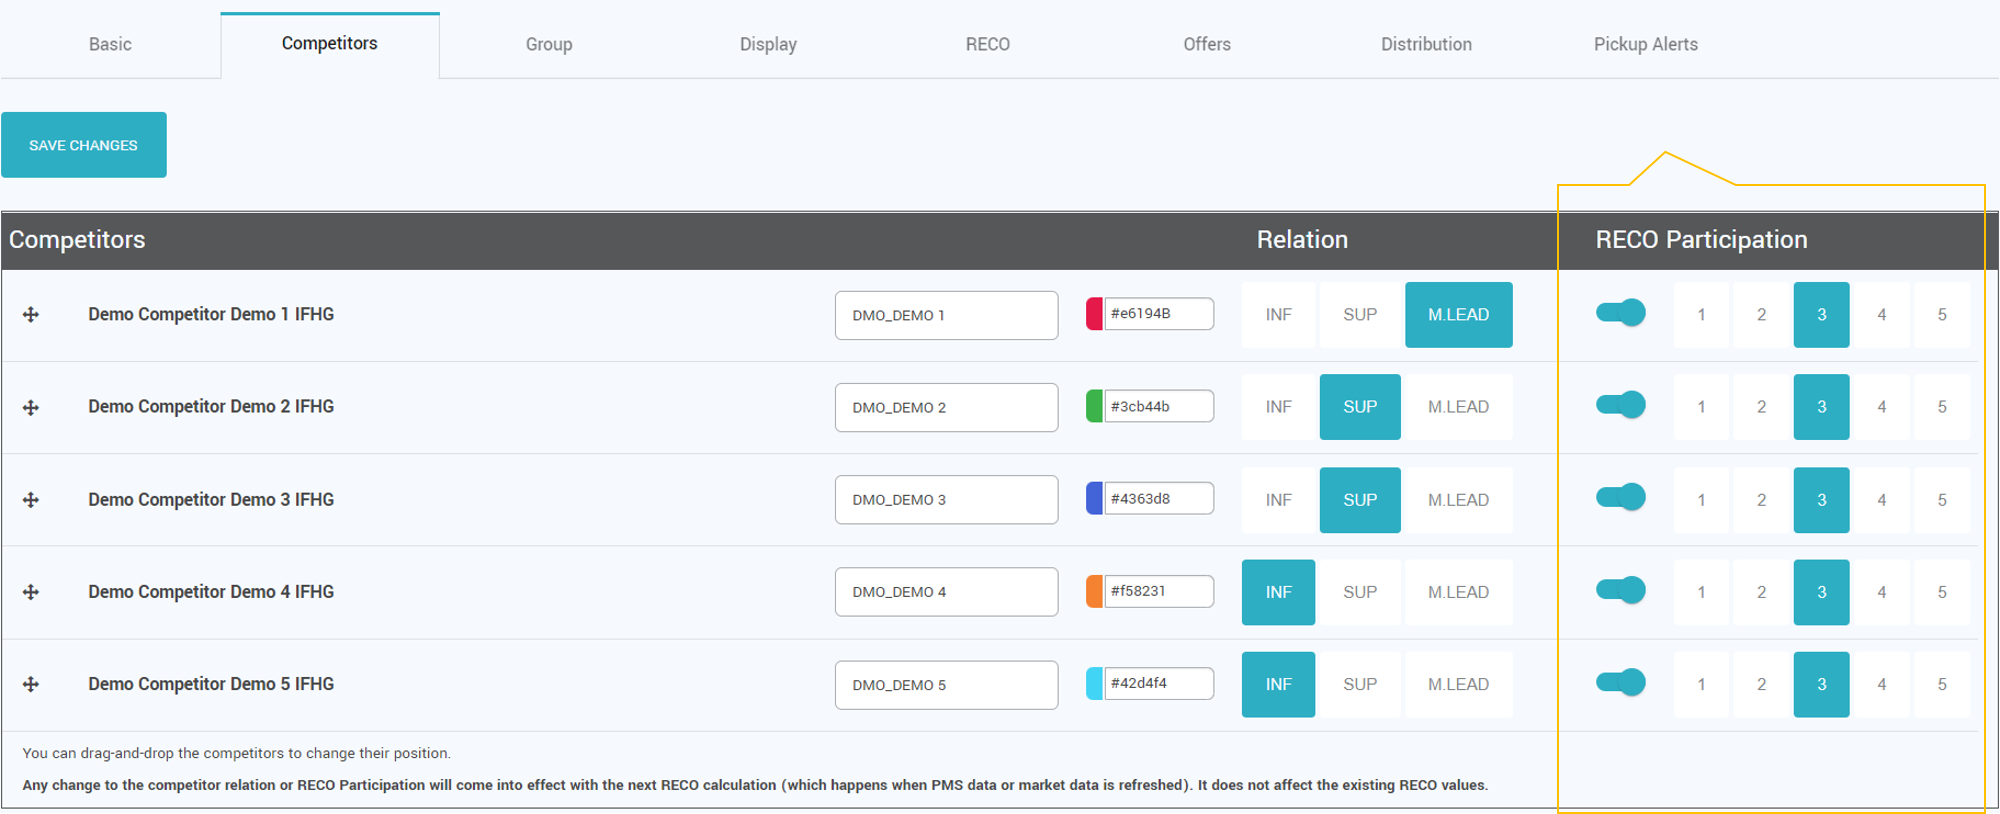
By default, the Influence Factor value for each competitor is taken from the old (Settings – RECO) parameter (which has now been removed) and all competitors are set to participate in the RECO calculation (fine tuning).
Competitors can be set to not participate at all in the fine-tuning process of the RECO rate. Practically, this means that one can set up competitors just for observation purposes.
AUTO PILOT
New functionality, available by default only to Key Admin users.
Auto Pilot functionality enables the app to send prices automatically or generate automatic alerts, based on predefined group of settings called “Workers”.
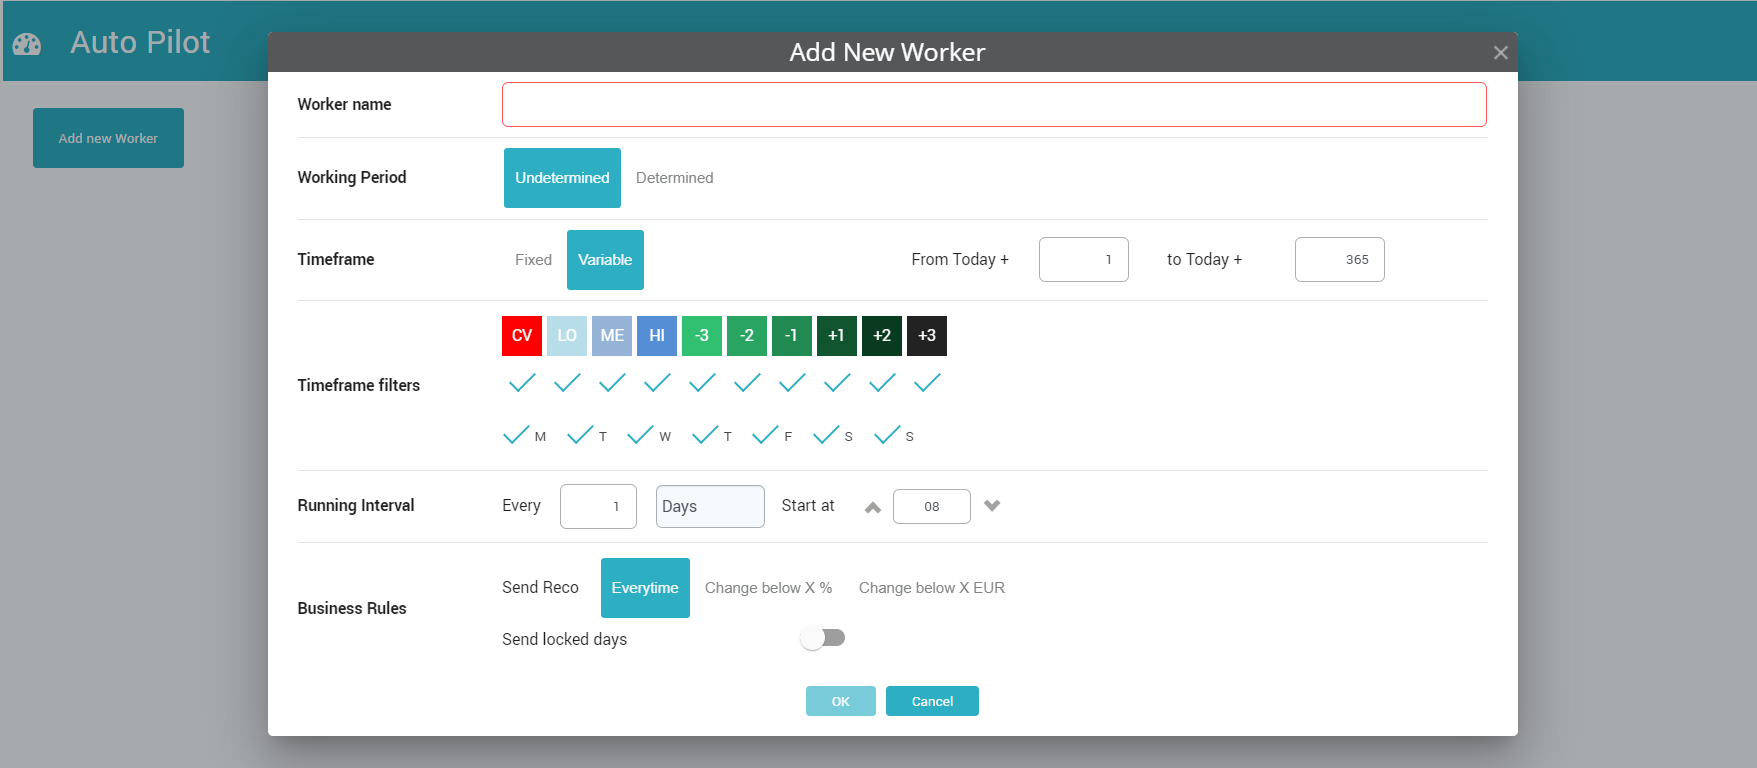
When adding a new worker, the following fields are to be filled in:
- Worker Name – name of the worker will be automatically linked to the user who created it.
- Working Period – it determines the validity period of the worker. If “Determined”, the worker is set to a fix validity period; if “Undetermined”, the worker will work indefinitely.
- Timeframe – it determines the arrival dates that the worker is allowed to analyze. This can be Fixed for particular arrival dates, or Variable based on the current date.
- Timeframe filters – additional filters that can be applied for the arrival dates that will be analyzed: Event type or particular days of the week.
- Running Interval – determines at what time will the worker do the job.
- Business Rules – define the job the worker has to do:
-
- Send RECO “Every time” – the worker will automatically like the recommended rate and send it to the receiving system.
- Send RECO when the change is below a defined % or value – the worker will first analyze the difference between the RECO rate and the Last Sent rate (or the last RECO in case no rate was sent for that particular arrival date). If the difference is below the allowed % or value, the worker will automatically send the rate.
- One can define if the worker should raise an alert when the change is above the % or value.
- One can define if the worker should also analyze locked days.
NB: A security pop up (password check) appears every time a new worker is created, edited or deleted and when any worker is activated / deactivated.
BREAKING CHANGES
- The menu High Pickup has been removed. It is replaced by the Alerts Module.
- The MTD Tab from Dashboard has been removed.