MULTI-PROPERTY OVERVIEW
This menu offers an overview of all hotels on which a user has access.
The most important KPIs RN, Revenue, ADR and RevPAR are displayed in table view, cards and graphs, according to the grouping and period selected. Budget and Forecast values are also analyzed.
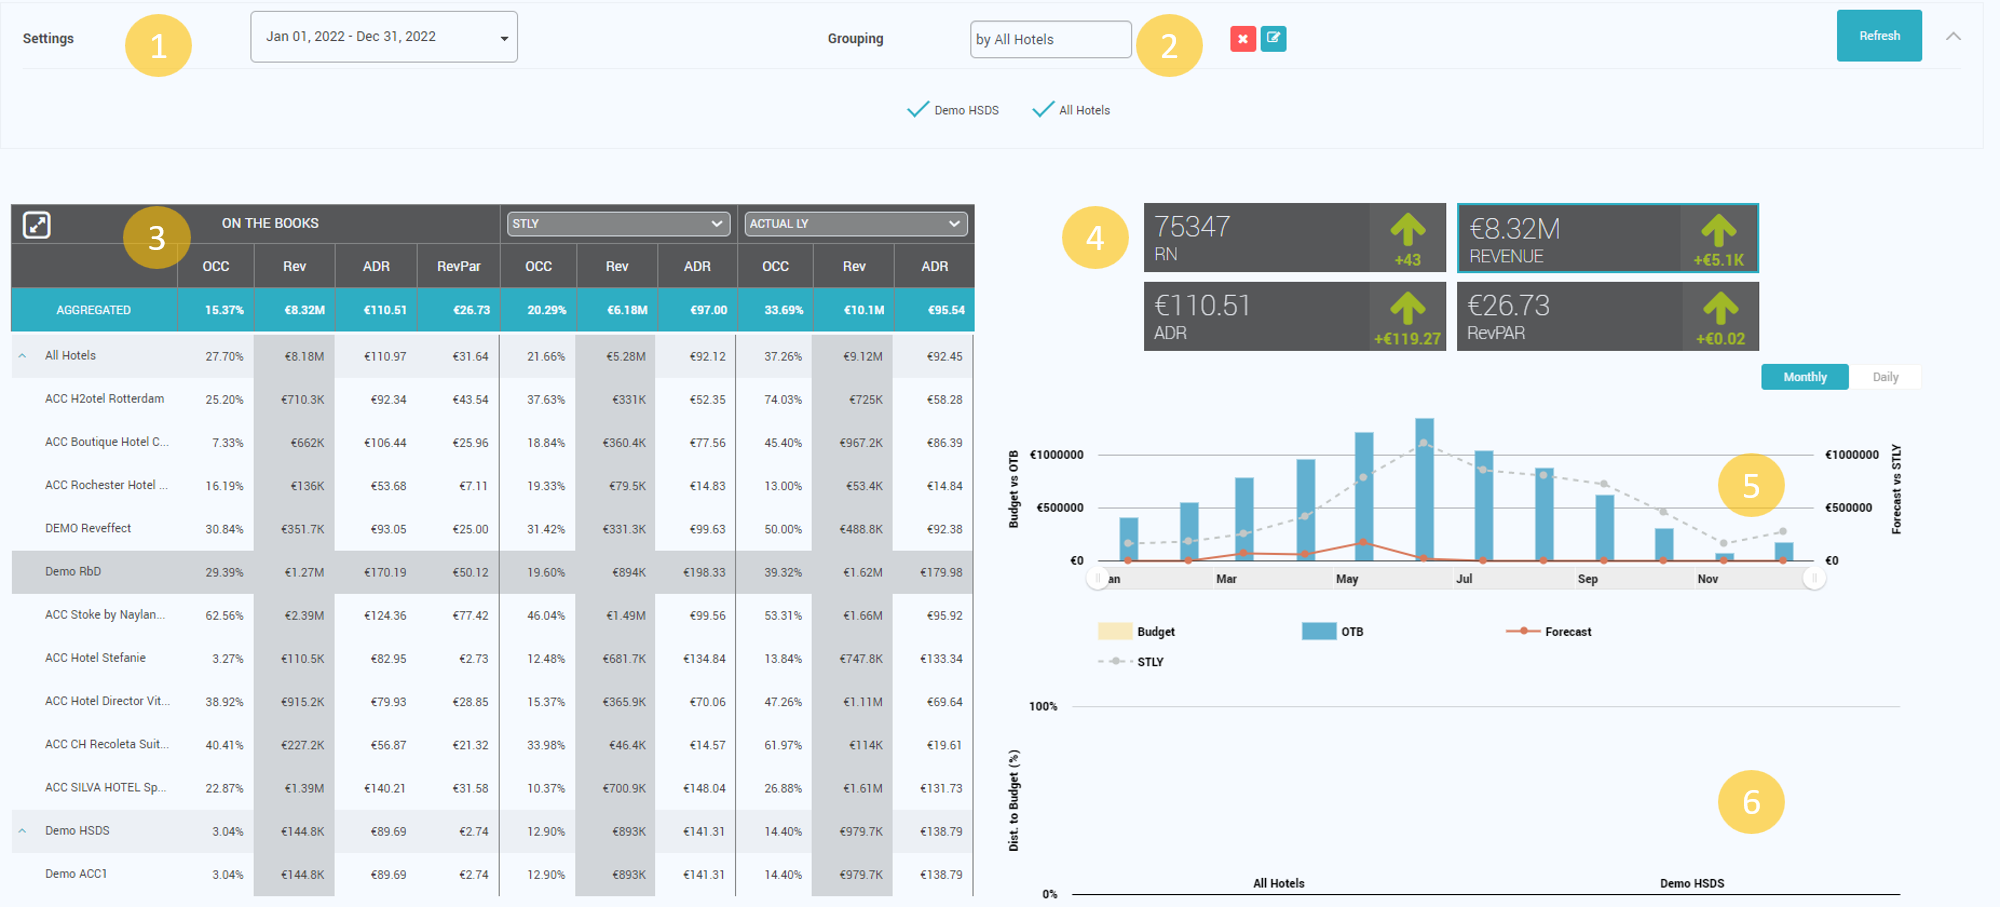
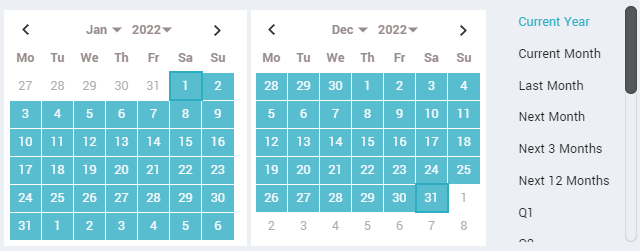
- The date range selector offers the possibility to either select specific periods that are not full months (available from v.2.13) or predefined periods: Yesterday, Today, Last month, Current month, Next month, Next 3 months, Next 12 months, Current year, Q1/2/3/4, S1, S2, Year to date, Date to year, Q1/2/3/4 Next Year, S1/S2 Next year.
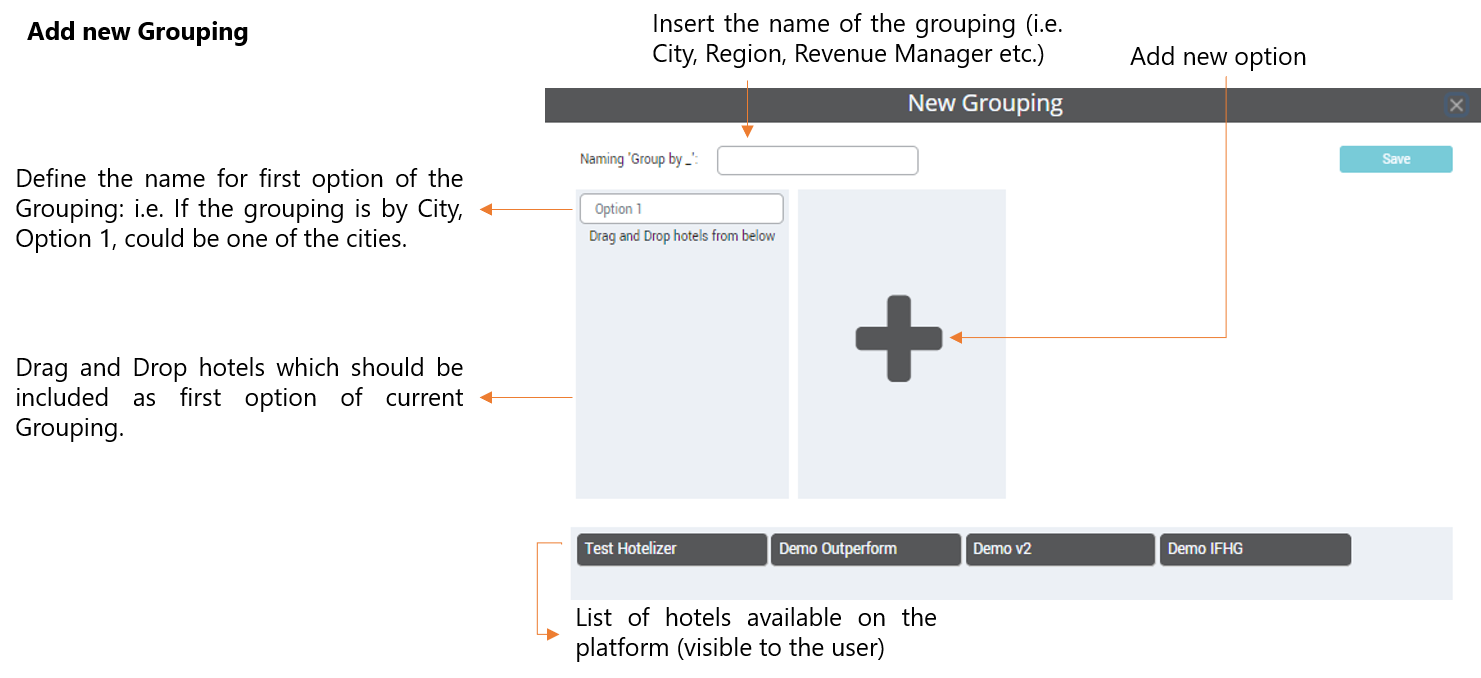
- Groupings are created according to each user’s needs. Each created grouping can have multiple options (e.g. grouping by cities with options for different cities). Existing Groupings can either be deleted or edited. Values can be viewed grouped or per each property. When selecting a group or a hotel, the cards and the graph display the values for the group or hotel selected in the table.
- Table view displaying values for the selected period and grouping, comparing OTB values with selected metrics: Budget, Distance to Budget, Forecast, Distance to Forecast, STLY, VAR to STLY, Actual LY, VAR to LY, Pickup 1 – 7, 14, 30. The table can be maximized for better view.
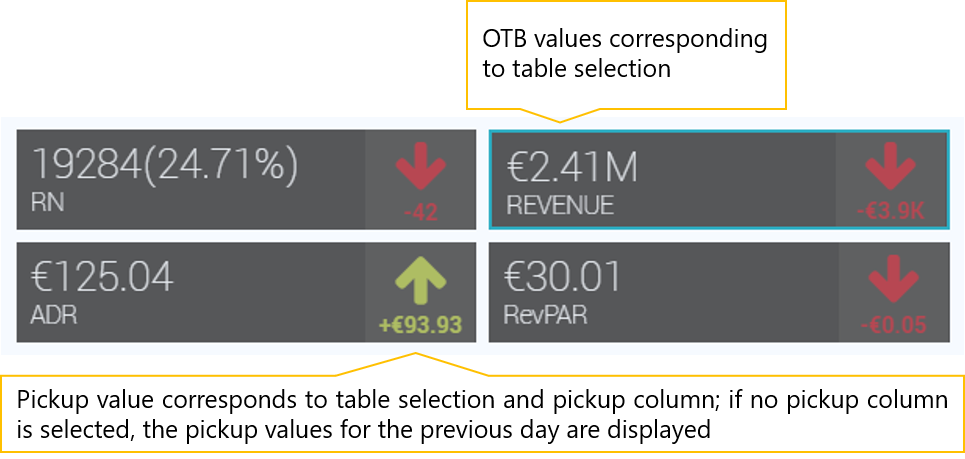
- OTB & Pickup Cards with the values for the most important KPIs, displaying data for the selected period and grouping: RN, Revenue, ADR and RevPAR. When clicking on a card, the below graphs display data for the selected KPI. The Green arrows (increase) and Red arrows (decrease) depict the Pickup value corresponding to table selection within pickup column. If no pickup column is selected, the pickup values for the previous day are displayed.
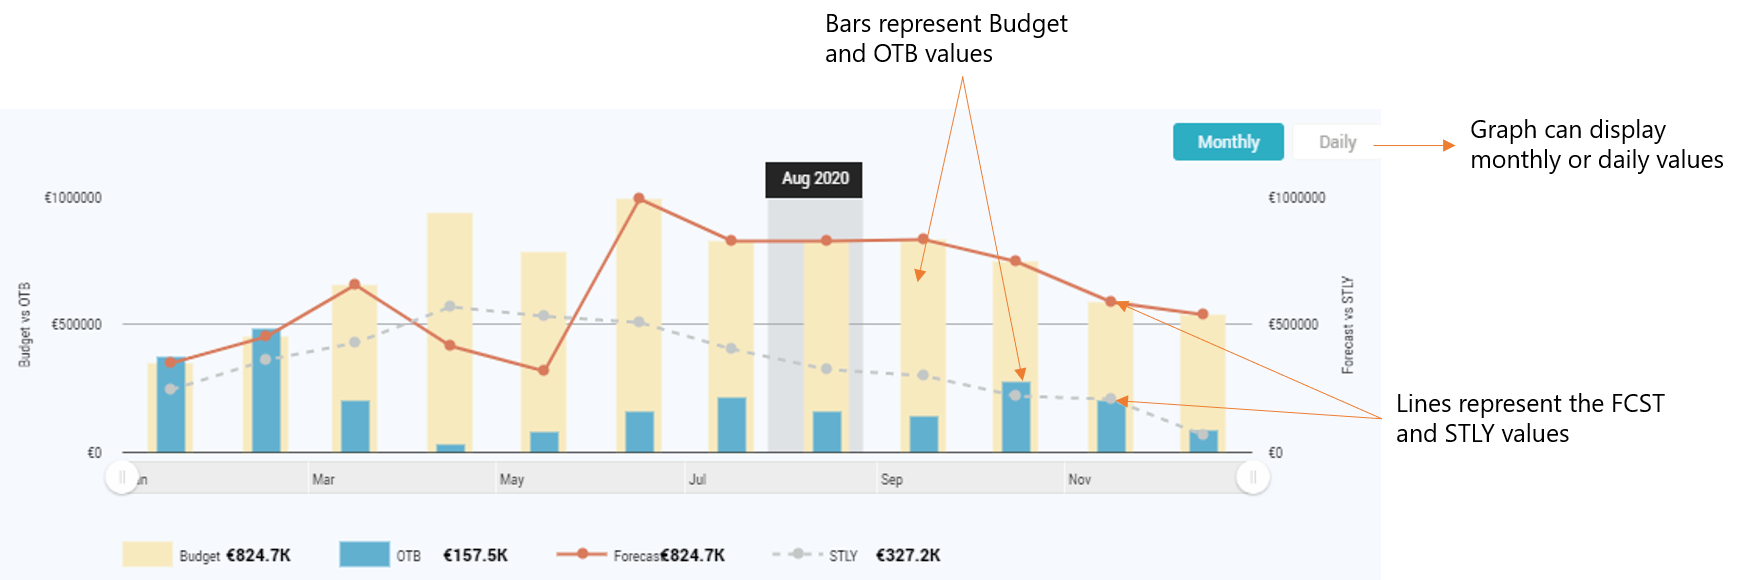
- Budget vs. OTB and Forecast vs. STLY. Graph can display monthly or daily values for Budget vs. OTB in bars and Forecast vs. STLY in lines.
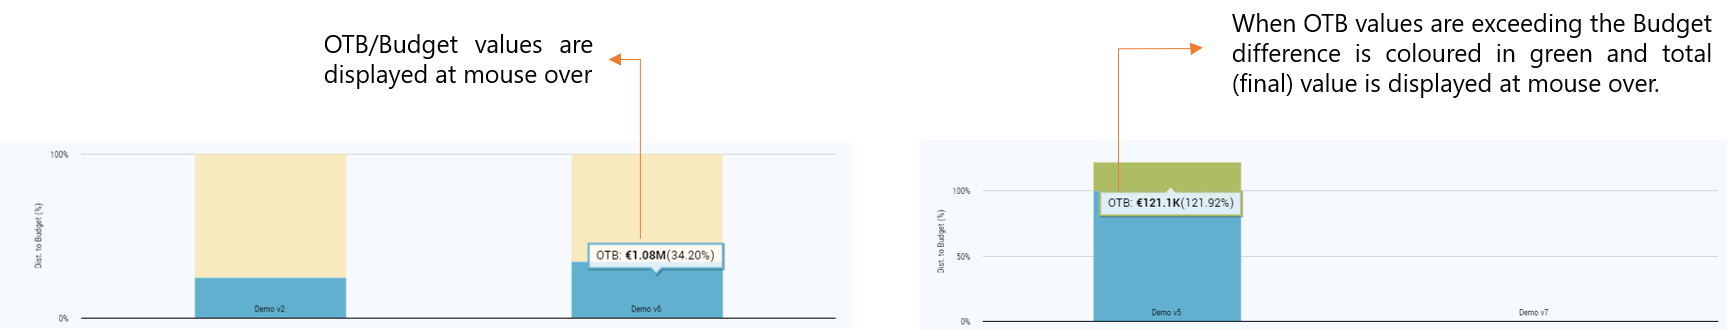
- Distance to Budget Graph – Grouped values for Distance to Budget